
6. Consumption metrics
Consumption Metrics shows how much AI and compute your site uses and what it costs. Use it to:
- See who uses AI chat the most, which models they use and what it costs.
- Track agent runs, reliability, speed, cost and quality over time.
- Find expensive jobs and datasets.
- Pull the same numbers into your own tools (see "Use the numbers in your own tools").
Open the metrics and pick a period#
Outcome: the numbers for the period you care about.
- Open Catalog in the top navigation and choose Consumption Metrics in the left menu.
- Choose a view: AI Chat, Agents, Workloads or APIs.
- At the right of the tab bar, choose the period. It applies to every view.

| Control | Period |
|---|---|
| 24h | The last 24 hours |
| 7d, 30d, 90d | Whole days (UTC). 30d is the default |
| Custom | A date-range popover with presets Today, Yesterday, Last 7 days, Last 30 days, This month, Last month, Quarter to date and Year to date, two date boxes and a calendar. Choose Apply |
| Refresh button | Reloads the numbers. A rolling 24 hours moves forward. Fixed day ranges keep their dates |

Headline numbers show how they changed compared with the previous period of the same length ("vs prev.").
Note
Costs are estimates. They use the provider's prices plus the Groundzero markup (20 percent). Calls whose usage is unknown are marked as estimated.
If part of the data cannot be loaded, the view shows a yellow notice (for example "AI metrics: ...") and keeps what did load. Some sites do not have the per-user breakdown, and then AI Chat shows "Per-user metrics are unavailable in this environment."
See who uses AI chat and what it costs#
Choose the AI Chat view.
| Block | What it tells you |
|---|---|
| KPI row | Total spend, Invocations, Active users, Requests, Tokens |
| Usage and spend by user | Users ranked by estimated cost, with requests and tokens |
| Invocations per request | Average model calls per chat request, per user |
| Tokens by model | Input, output, cache read and cache write tokens per model, with a Chart or Table switch |
| User breakdown | A table of User, Requests, Invocations, Tokens and Estimated cost, with Search users |
| Model breakdown | A table per model including Output speed (tokens per second), First token (median) and Estimated cost, with a note counting estimated invocations |

Charts show the top 20 rows and say "Top 20 of N users ranked by estimated cost." when there are more.
What to do with it: if one person or model drives the cost, ask your administrator to set or adjust a budget (Administration guide, chapter 7).
Track how your agents are doing#
Choose the Agents view.
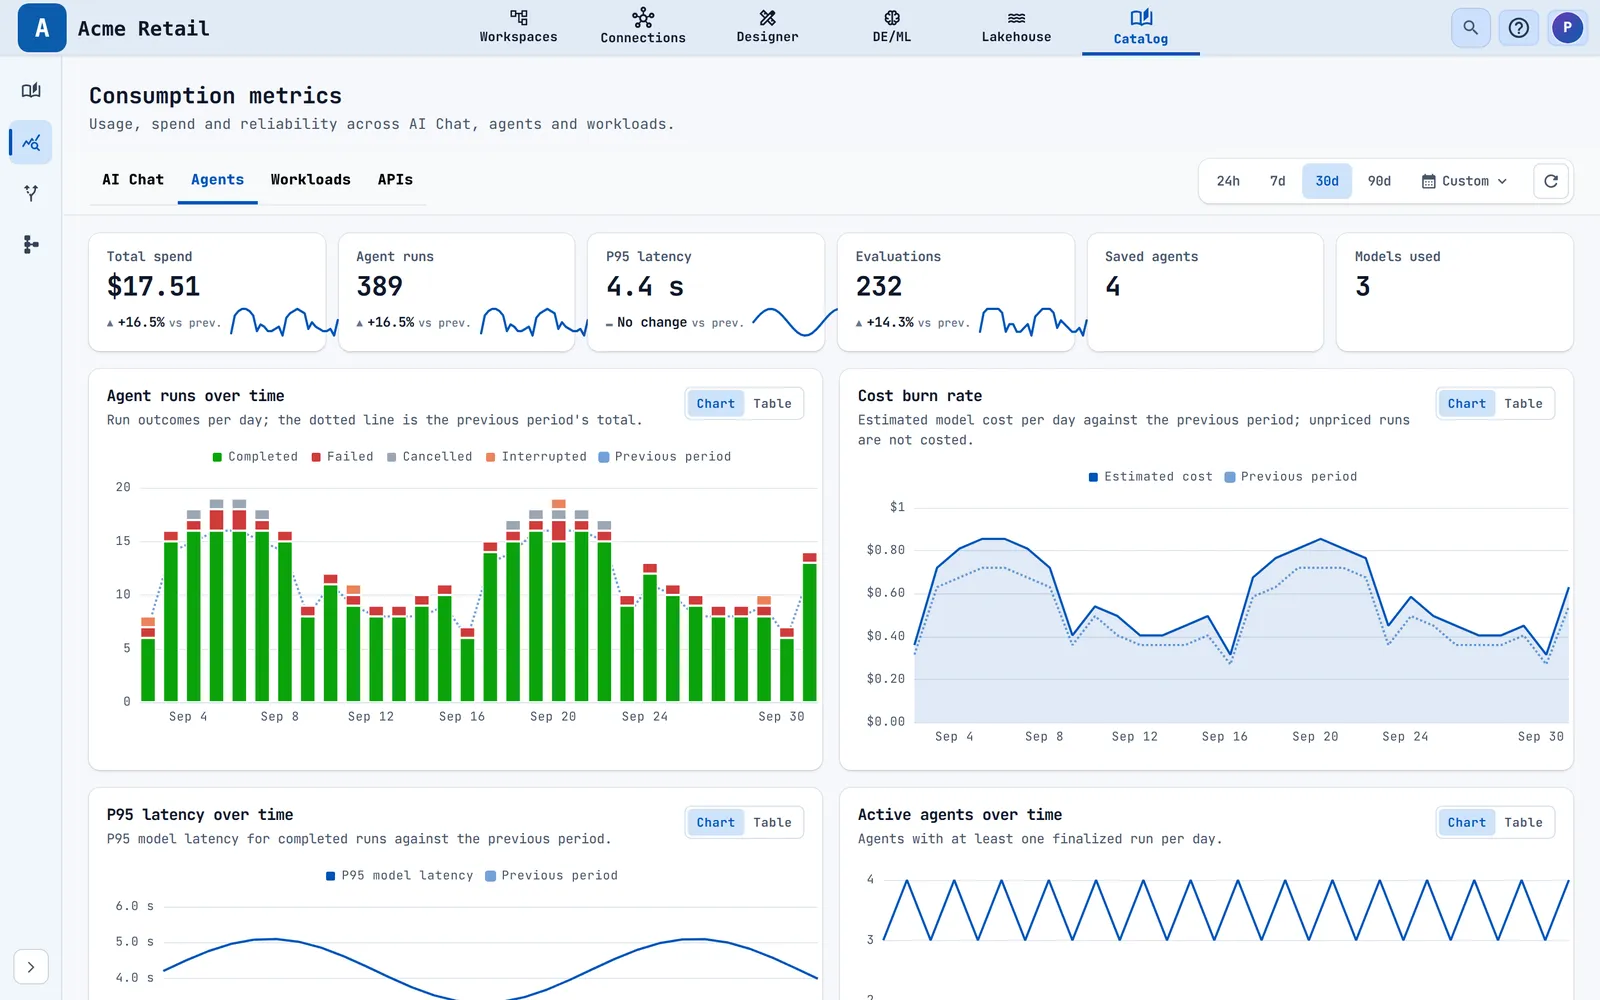
KPIs are Total spend, Agent runs, P95 latency (the time within which 95 percent of runs finish), Evaluations, Saved agents and Models used, with trend lines. The charts compare with the previous period (dotted lines):
- Agent runs over time: Completed, Failed, Cancelled and Interrupted runs.
- Cost burn rate: estimated model cost per day. Runs with no known price are not costed.
- Runs per active agent, P95 latency and Active agents over time.
- Model adoption over time, Evaluation quality over time and Evaluation dimensions over time (Helpfulness, Correctness, Relevance, Coherence, Conciseness, Goal completion, Tool use).
- Model breakdown table.

Only finished runs of saved agents are included. For 24 hours the points are hourly. Longer ranges use days or weeks.
Find expensive jobs and datasets#
Choose the Workloads view. It shows how much ETL jobs and datasets consume. Drill from Projects to a project, a job and a single run, and switch between Jobs and Datasets. Tiles show Executions, Success rate, Average duration, CPU consumed, Memory consumed and Cost.
With no runs in the period you see "No projects found: Change the period or filters to include executions."

For how jobs and datasets run, see the Build and Run guide.
Use the numbers in your own tools#
Choose the APIs view. It lists the metric calls you can make from your own scripts and reports, each with its parameters, what it returns and a ready-made cURL command to copy.
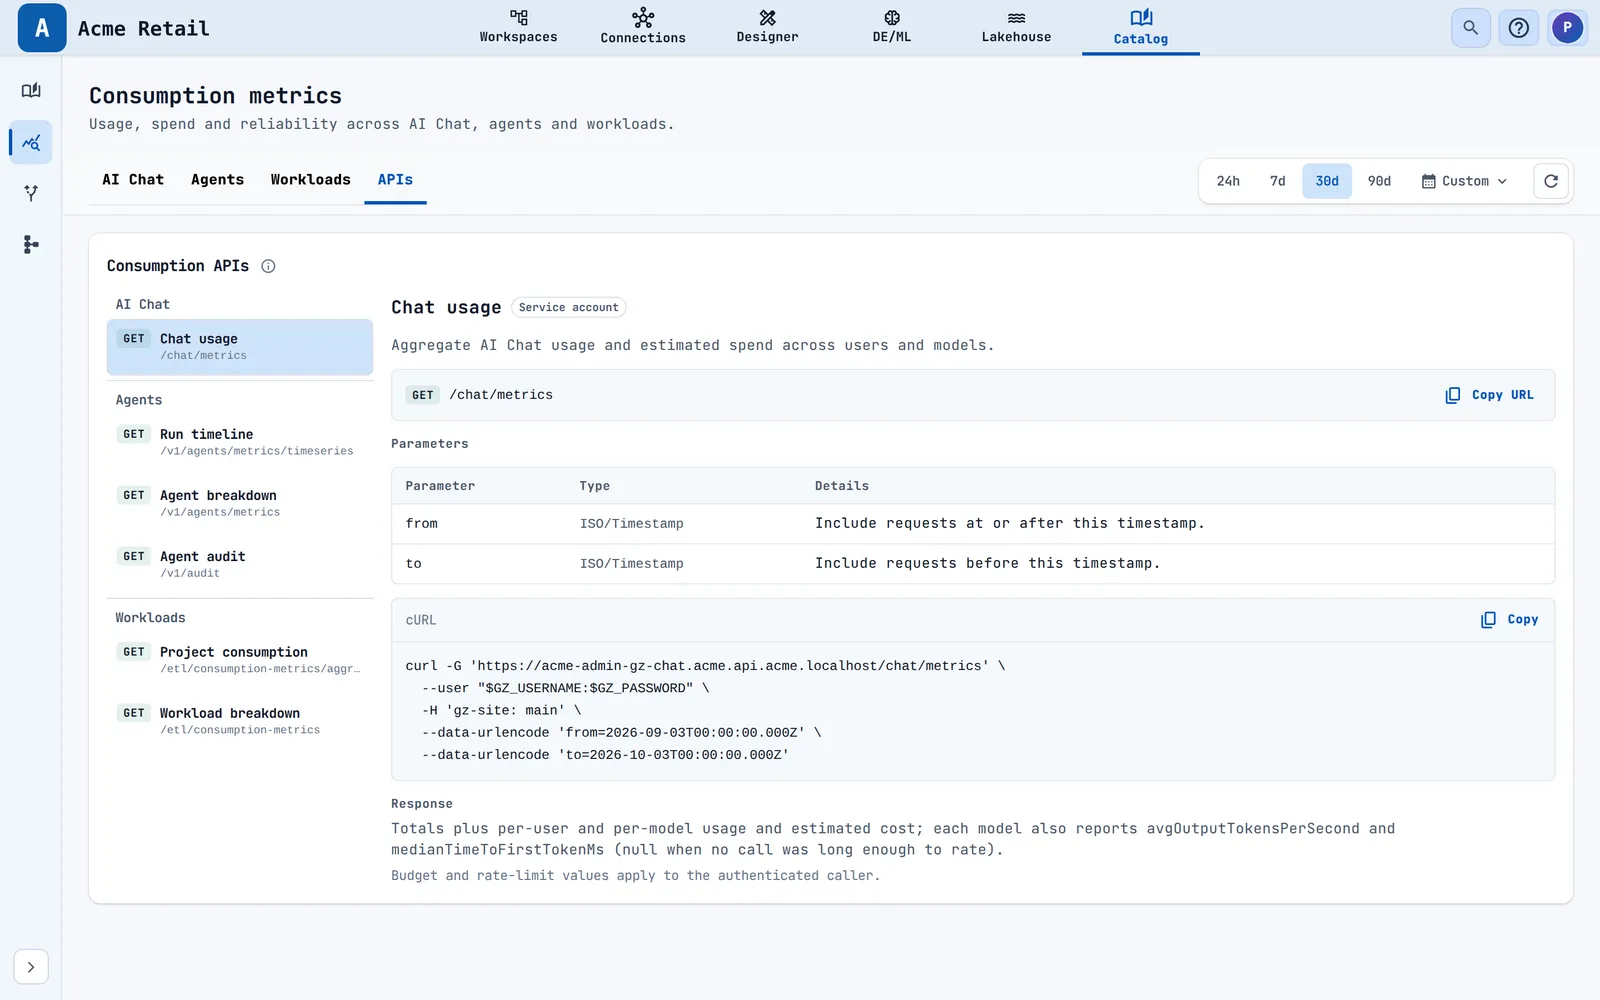
The calls cover:
| Group | What you get |
|---|---|
| AI Chat | Chat usage and estimated spend by user and model for a date range |
| Agents | Run, model, token, latency and cost totals per agent, and totals per hour, day or week, plus the lifecycle and action history of saved agents |
| Workloads | The workload breakdown and consumption per project |
To run an example, replace the $GZ_USERNAME and $GZ_PASSWORD placeholders with your own sign-in. Chapter 7 lists the other ways to reach Groundzero from your own tools.
Troubleshooting#
- "Unable to load AI metrics." Cause: the data could not be loaded. Fix: choose the refresh button.
- "Unable to load saved-agent metrics." or "Unable to load agent trends." Fix: refresh. If it repeats, try a shorter period.
- A cost shows an "estimated invocations" or "unpriced" note. Cause: the model provider did not report its usage, so the cost is an estimate or left out. Fix: none needed. Treat the figure as approximate.
- The "vs prev." changes are missing. Cause: the previous period could not be loaded. Fix: refresh.
- Workloads says "No projects found". Cause: nothing ran in the period. Fix: widen the period.
Related chapters#
- The Administration guide, chapter 7, for budgets, which cap AI chat spend.
- Chapter 5 for the metrics of a single agent.