
3. Dashboards
A dashboard arranges visualizations, text, shapes and filter controls on a free-form canvas, organised into tabs. You build dashboards in Designer > Dashboards, publish them, and readers open the published copy from Workspaces.
Before you start you need saved visualizations to place on the dashboard (chapter 1) and the Dashboard, Visualization and Workspace permissions (Administration guide, chapter 4).
Open the Dashboards list#
Open Designer and choose Dashboards in the left rail.

The header has Import Dashboard and New Dashboard. The toolbar has Search Dashboards, Created By and Created On. Columns are Name (opens the dashboard), Last Updated By, Last Updated On and Actions.
Build a dashboard from your charts#
Outcome: a saved dashboard with your charts, laid out the way you want.
- Choose New Dashboard.
- In Enter Name type a name that follows the naming rule, then choose Add. The toast says "<name> added successfully". Groundzero does not open the new dashboard.
- Click the dashboard's name to open the editor.
- Open the Select visualizations tab in the right panel and tick the charts you want. Each one adds a tile to the active tab.
- Drag and resize the tiles on the canvas.
- Choose Save dashboard in the header. The toast says "Successfully updated".

How to check it worked: close the dashboard and open it again. The layout is as you left it.
Note
Layout changes stay in your browser until you choose Save dashboard.
Find your way around the editor#

| Area | What it does |
|---|---|
| Header (top) | Breadcrumb and toolbar: Publish, Save dashboard, Reset filters (when enabled), Export dashboard |
| Canvas | The active tab. Drag and resize tiles. Tiles are free-form and can overlap |
| Right panel | Three icon tabs: Select visualizations, Setup and Customize. A slim handle collapses it |
| Bottom bar | The tabs of the dashboard, a menu on each tab, and + to add one |
Add and remove charts#
The Select visualizations tab lists every visualization with a checkbox.
- Search visualization filters by name.
- The person icon (Filter by creator) filters by creator.
- Checking a visualization adds a tile to the active tab. Unchecking removes it. Selected items sort to the top.
When a chart joins the tab, its dataset filters appear as filter controls on the canvas.
Hover a tile for two icons: a pin that locks the tile's position and an X that removes it. X asks Are you sure you want to remove visualization <name> from this dashboard?
Organise a dashboard into tabs#
Each tab shows its label and a menu (tab actions).
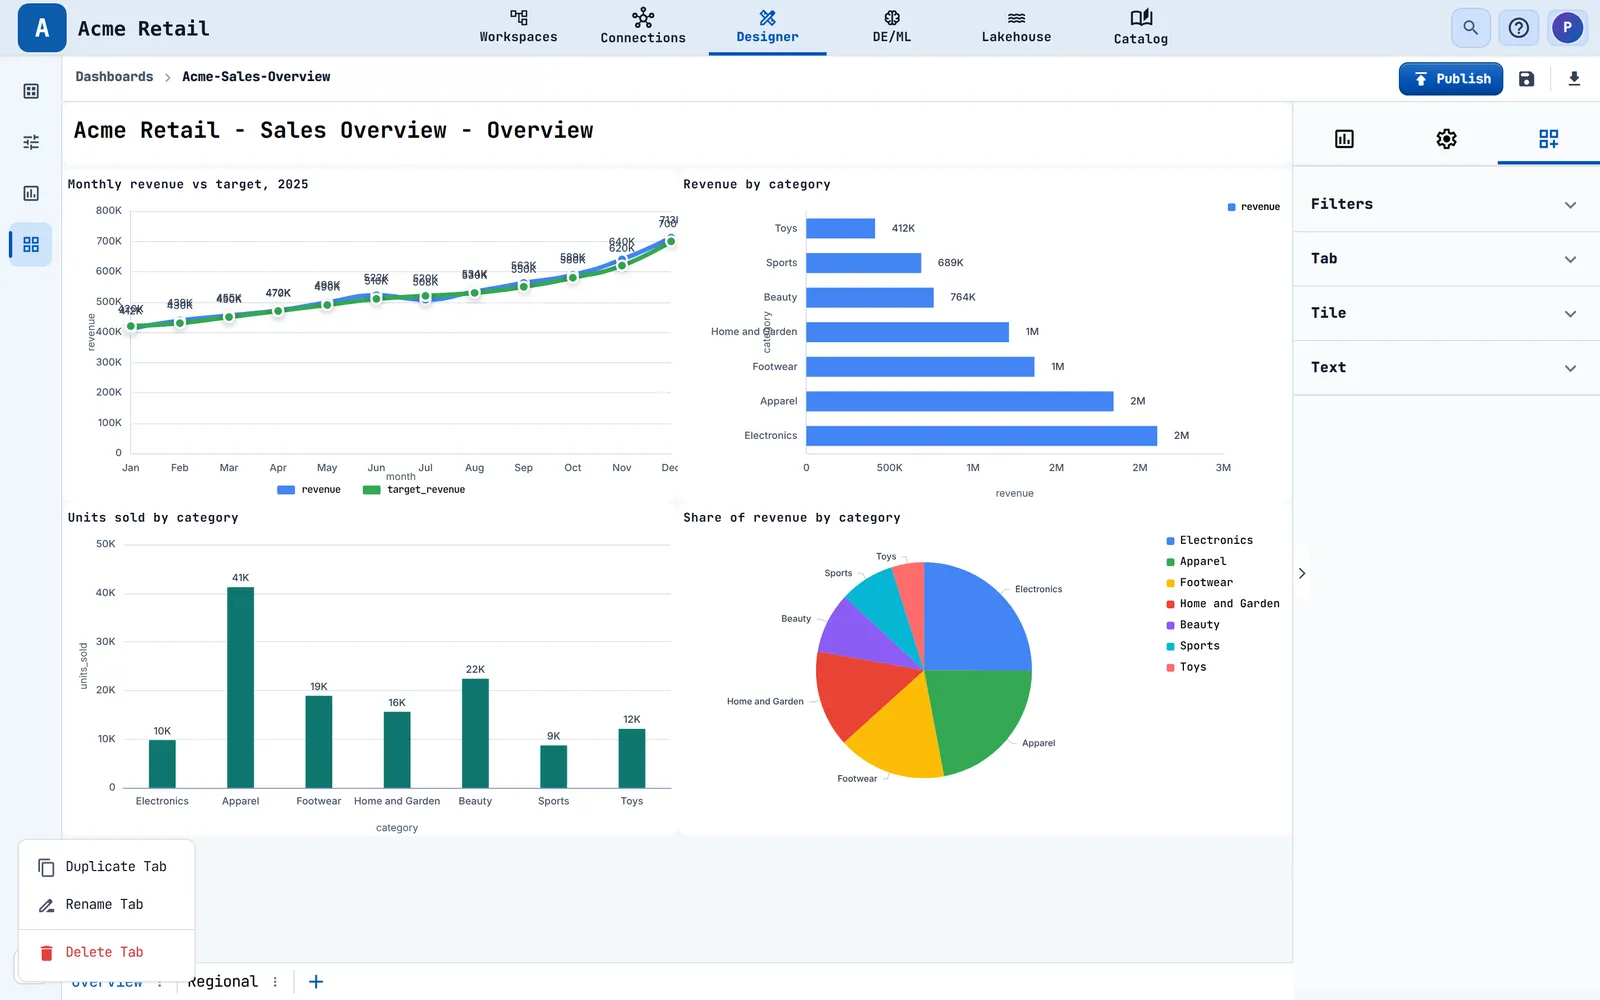
| Action | What happens |
|---|---|
| + (Add New Tab) | Enter a name. An empty or repeated name (any capitalisation) shows "Tab name already exists. Please choose a different name." |
| Rename Tab | Shows "Tab name is invalid or already exists. Please choose a different name." when refused |
| Duplicate Tab | Copies layout, tiles, shapes and filter styles into a new tab named "<label> (Copy)", "(Copy 2)" and so on |
| Delete Tab | Asks you to confirm. The only remaining tab cannot be deleted: "Cannot delete the only tab. A dashboard must have at least one tab." |
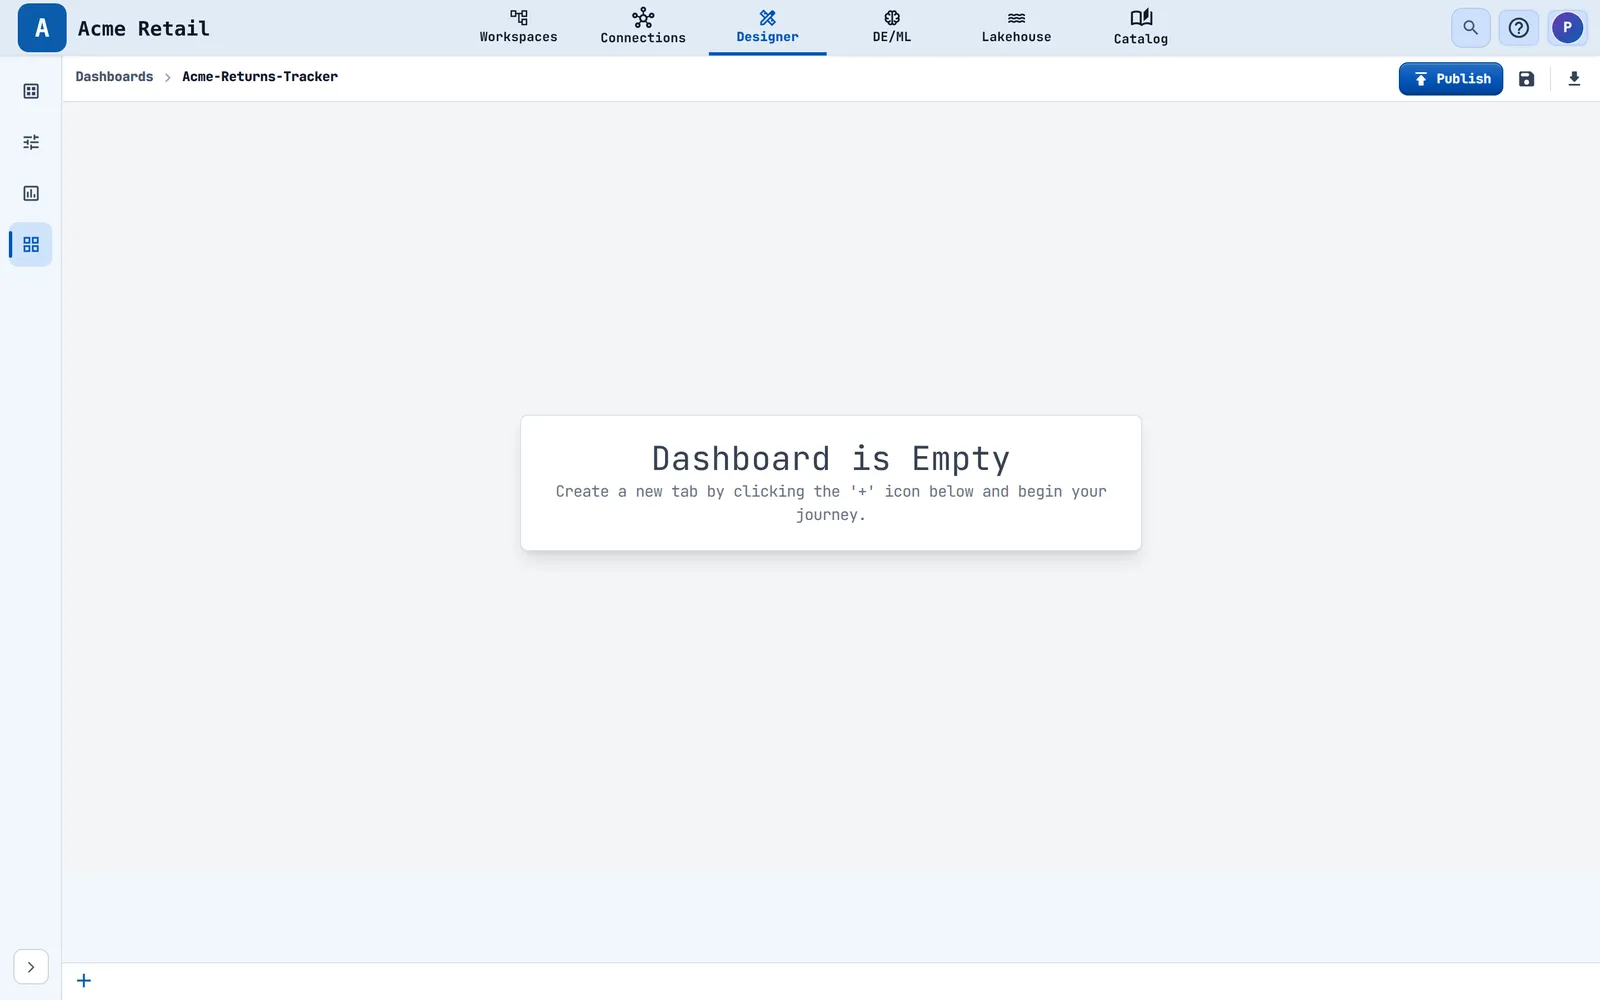
A dashboard with no content shows "Dashboard is Empty" and asks you to create a tab with the + icon.
Style tiles and tabs#
Open the Customize tab. Click a tile to select it (a dashed blue outline). Ctrl or Cmd click selects several.
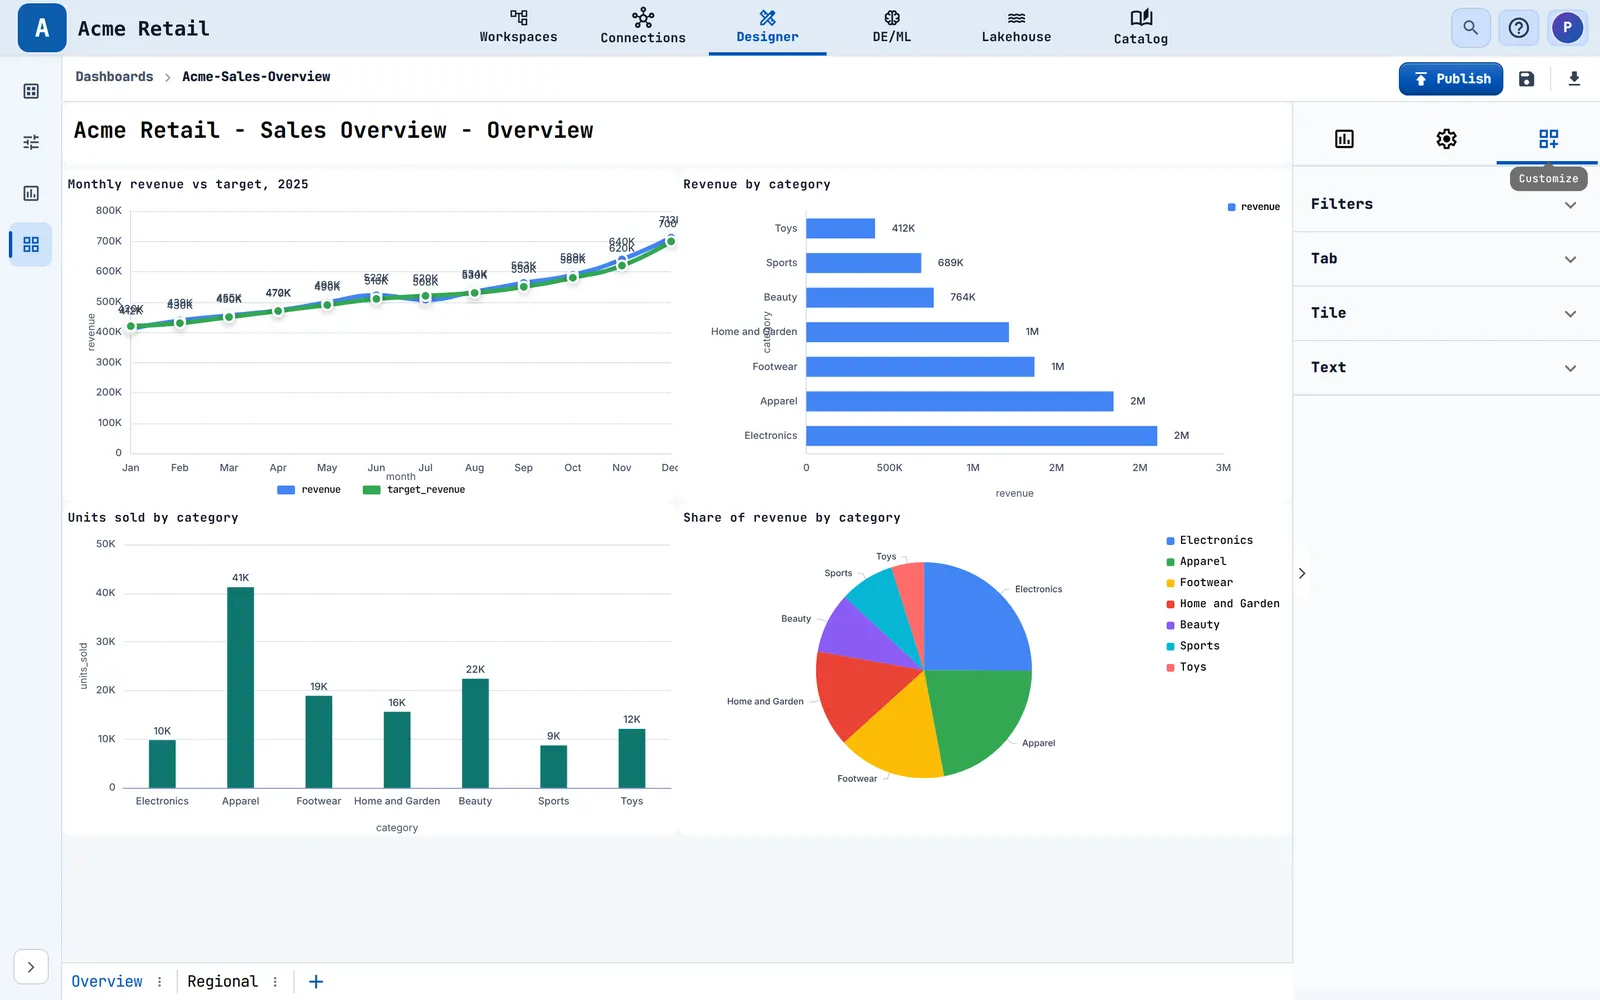
| Section | Controls |
|---|---|
| Filters | Switch Reset filters button adds a header control that restores every filter to its saved default |
| Tab | Canvas background color, Background image (upload or delete) |
| Tile (selected tiles, shapes and filters) | Border color, Background color, Background image, Border style (Solid, Dotted, Dashed, Groove, Double), Border width, Corner radius, Padding, Row height, Row width, Horizontal position (X), Vertical position (Y) |
| Text | Align (left, center, right), Font color, font family, font size 10 to 36, bold, italic |
Add text and shapes#
In the Setup tab, open Text and Shapes to add a shape to the active tab: circle, textbox, rectangle, rounded rectangle, line, dotted line, several arrows, triangle, pentagon, hexagon or diamond. A new shape appears at the top left. Drag and resize it. A textbox is a free text widget: click it and type. Hover a shape for the red X (Remove Shape) and for ordering icons.
Let readers click a chart to filter or jump#
Outcome: clicking a value in one chart filters other charts, switches to another tab, or sends the chart behind the others.

- In the Setup tab, choose + next to Add Trigger. The New Trigger dialog opens.
- Fill in the fields below.
- Confirm the dialog, then choose Save dashboard.
| Field | Meaning |
|---|---|
| Name | Unique within the tab. A repeat shows "Trigger name already exists in this tab." |
| Event | Filter, Navigate, Filter and Navigate or Send to back |
| Source | The chart whose click starts the trigger |
| Select Attribute | The column whose clicked value is used (hidden for Send to back) |
| Target > Select Tab | Where to go. For Filter it is fixed to the current tab |
| Target > Select Charts / Select Filters | What to filter (hidden for Navigate) |
How to check it worked: click the source chart. The target charts filter, the tab changes, or the source tile moves behind the others. After Send to back, a Back to Original arrow brings it back.
Let readers switch between stacked charts#
Dashboard Filters add a single-select control that is not tied to a dataset column. Choosing a value brings one chart to the front, so you can stack several tiles in one spot and switch between them.
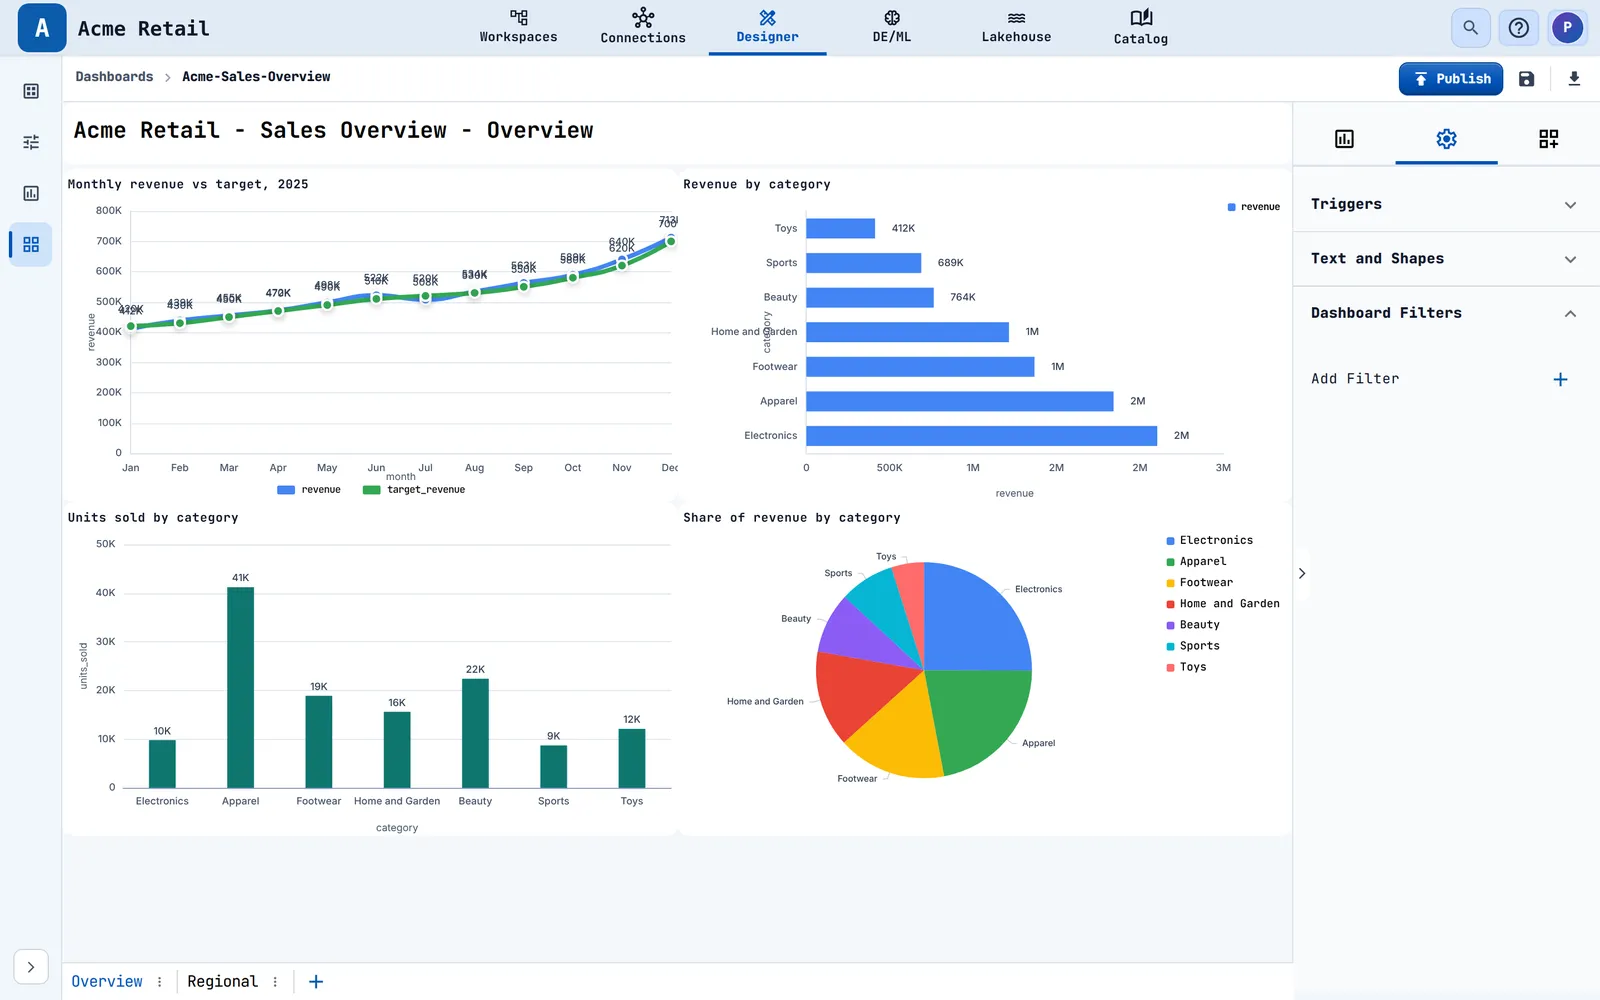
- In the Setup tab, open Dashboard Filters and add a filter. The Configure Dashboard Filters dialog opens.
- Type a Name.
- Under Filter Value, type the text readers will see, pick the Chart that value should bring to the front, and choose +. The toast says "Item added successfully".
- Repeat for each chart. Edit Display Values lists the pairs for editing or deletion.
- Pick the default value. Add stays disabled until there is a name and a default value.
Filters on a dashboard#
Every filter attached to the charts on a tab (apart from hidden ones) is drawn as a control that you can move, resize and style. Changing a value re-runs every chart that uses that filter on the tab. Reset filters puts every filter and dashboard-filter choice back to what it was when the dashboard loaded.
Readers' filter choices are not saved with the dashboard. What is saved is the Reset filters setting, the dashboard filters you defined and their defaults.
Publish a dashboard#
Outcome: readers can open a read-only copy from Workspaces.
- Choose Save dashboard first. Publishing does not save your latest edits.
- Choose Publish.
- Confirm
Are you sure you want to publish "<name>"?Groundzero publishes the dashboard with every visualization and dataset it uses. - The toast says "Successfully published".

An empty dashboard shows "Dashboard is empty, add some items and publish." when you try to publish and "Dashboard is empty, add some items and save." when you try to save.
Warning
Publishing overwrites the published copy that has the same name, and does not save your Designer copy first. Always choose Save dashboard too.
What happens next: the published dashboard appears in Workspaces for people to read, and in the Deployment Manager, where administrators can copy it to other sites (Administration guide, chapter 10).
Export a dashboard to PDF or Excel#
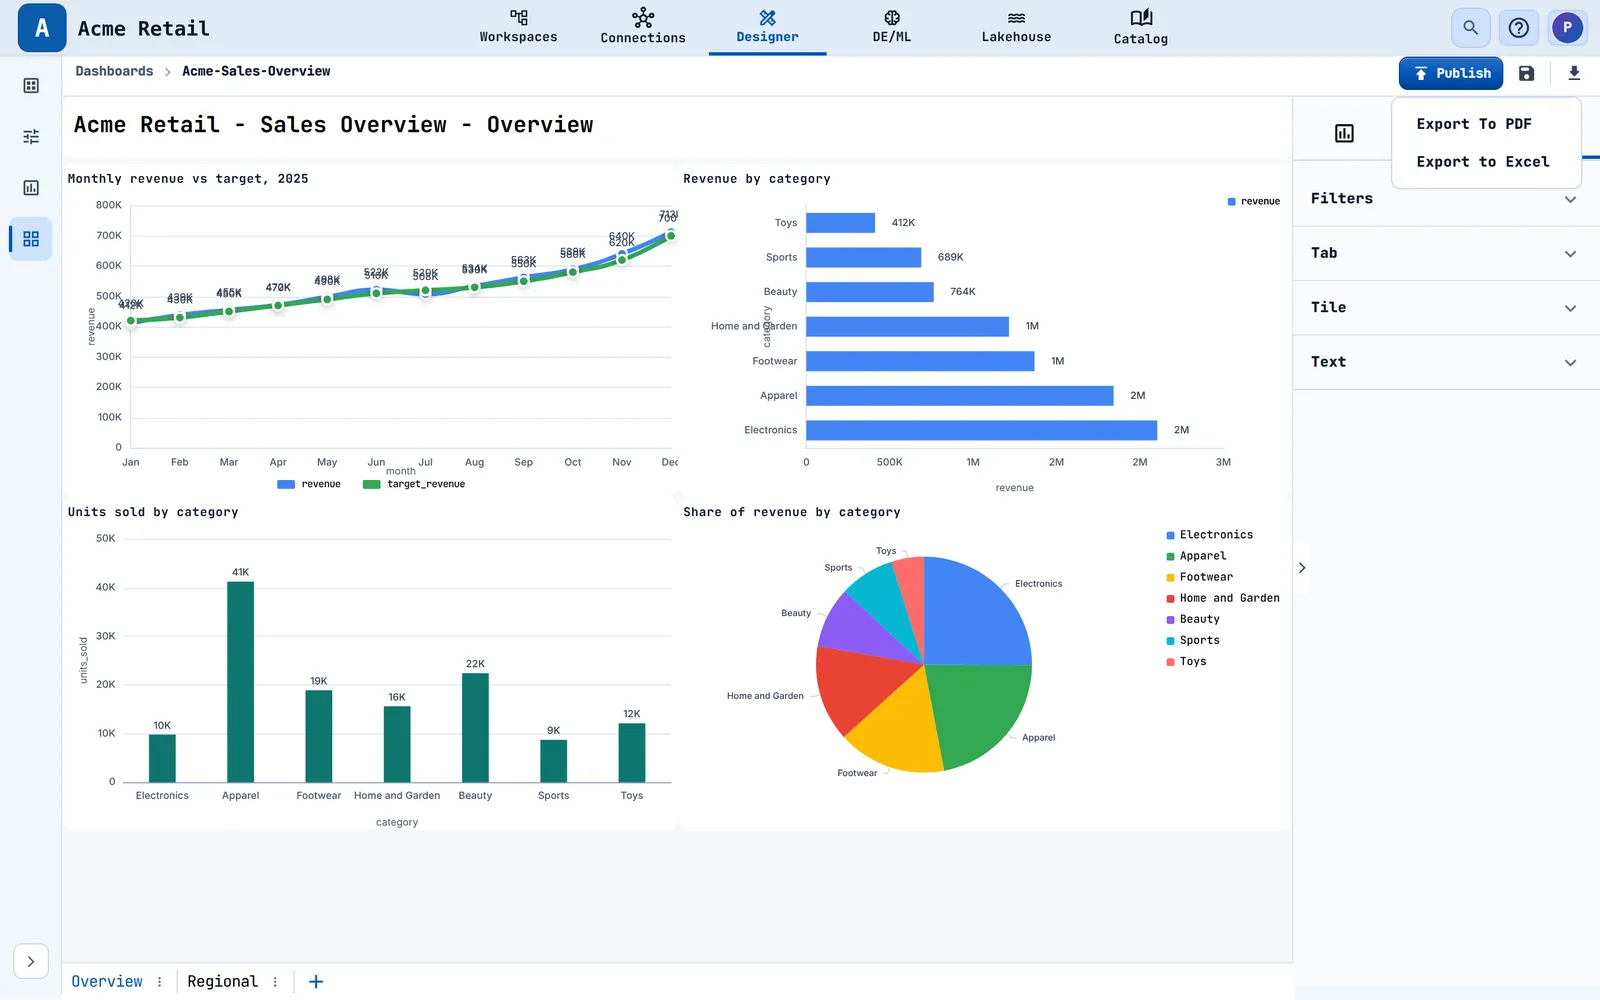
- Open the tab you want to export. Exports cover one tab at a time.
- Choose Export dashboard, then Export To PDF or Export to Excel.
- Wait for the info toast ("Preparing PDF file for download..." or "Preparing Excel file for download..."). The file downloads.
PDF captures the tab as it looks, and is named <tab label>.pdf. Excel is named <tab label>.xlsx and has one sheet per chart on the tab, with data re-queried using the current filters. Sheet names longer than 31 characters are shortened.
Read a published dashboard in a workspace#
Workspaces in the top navigation lists folders called workspaces. Each holds published dashboards.
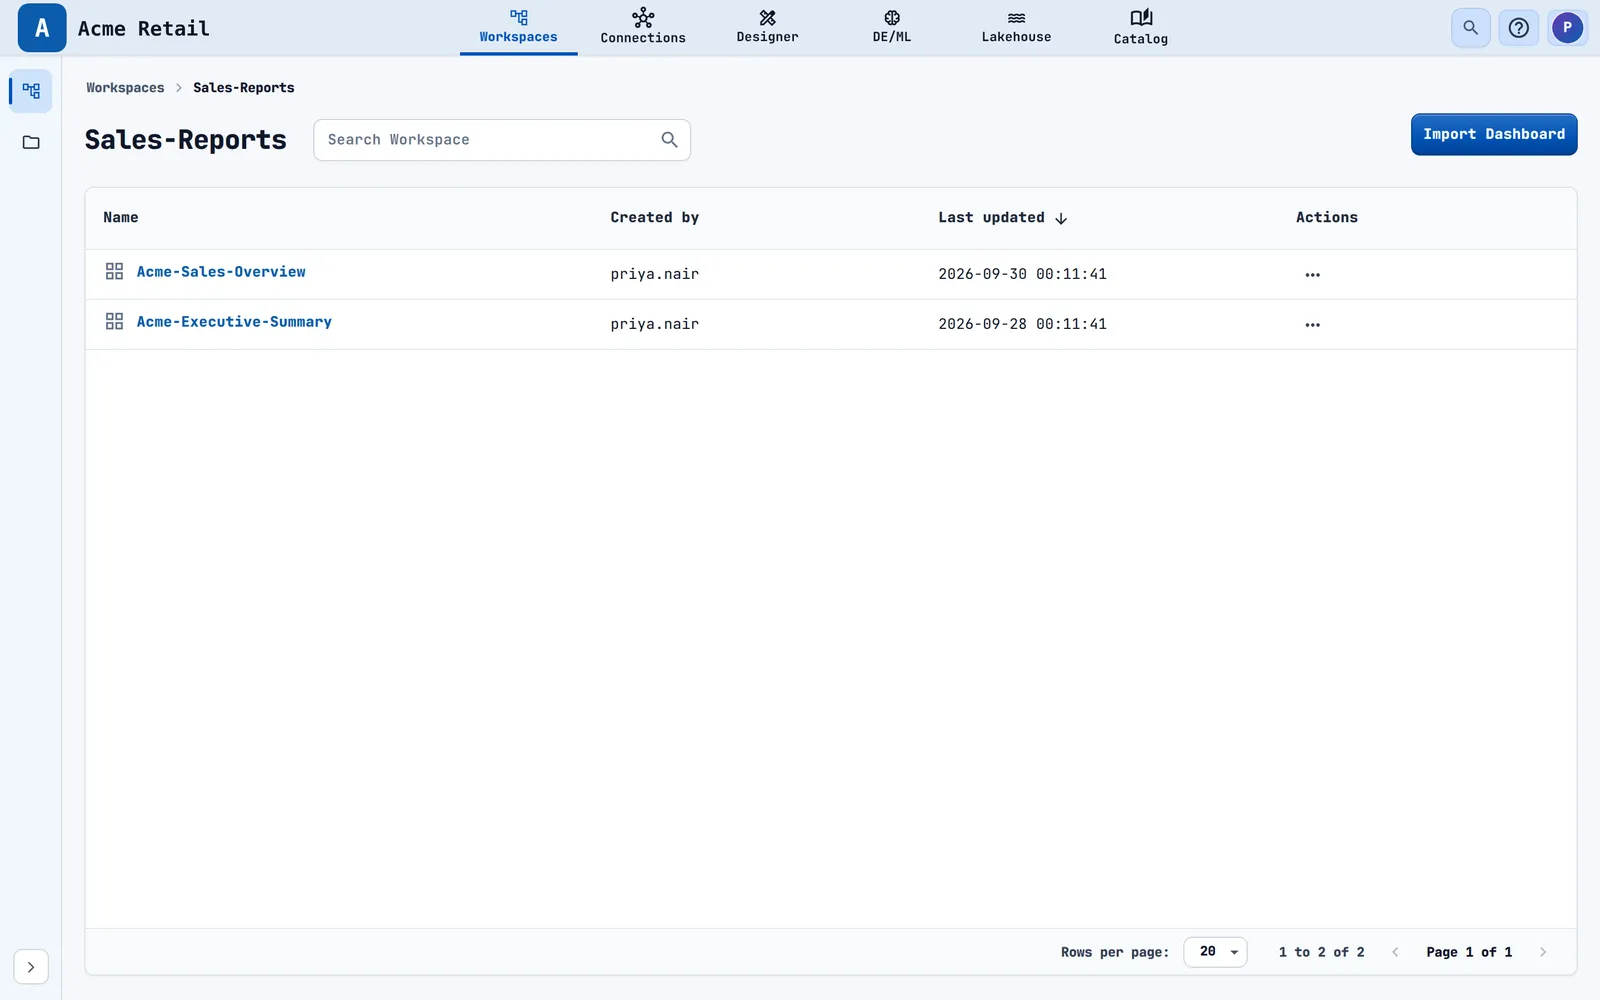
- Open Workspaces and choose a workspace. You see its dashboards with Created by and Last updated.
- Click a dashboard to open the read-only viewer. Use the tabs, Reset filters (if enabled) and Export. Tiles are locked.
To manage workspaces:
- New Workspace opens Add Workspace and uses the same naming rule.
- A workspace's Actions menu offers Rename, Delete and, for administrators only, Change Owner.
- Inside a workspace, Rename and Delete are available per dashboard.
Copy a published dashboard to edit it#
Import Dashboard copies a published dashboard into the Designer so you can change it.
- In Designer > Dashboards, choose Import Dashboard.
- In Select a dashboard pick a published dashboard.
- Choose Import.

Groundzero makes copies of every dataset, custom filter and visualization the dashboard uses, each with a unique ending added to its name, and creates a dashboard named <published name>-<yyMMddHHmmss>. The toast says "Dashboard imported as
Import into a workspace#
- Open the workspace and choose Import Dashboard.
- Pick a published dashboard and choose Import.

If a dashboard with the same name is already in that workspace, the Dashboard Name Conflict dialog appears:
| Button | Result |
|---|---|
| Replace | Overwrites the existing dashboard. Toast "<name> replaced successfully" |
| Keep Both | Imports under <name>-<yyMMddHHmmss> |
| Cancel | Does nothing |
When you import several published dashboards at once, a Do it for all checkbox applies one choice to every conflict.
Administrators can also copy published dashboards to other sites (Administration guide, chapter 10).
Rename or delete a dashboard#

Rename fills in the current Dashboard Name and applies the naming rule. Delete asks Are you sure you want to delete "<name>" ?.
Troubleshooting#
- A tile shows "Failed to fetch data: <chart> (Id: <id>) may be deleted or inaccessible". Cause: the visualization was deleted, or you do not have permission to read it. Fix: add the chart again, or ask an administrator for access.
- A tile shows "Dataset could not be loaded". Cause: the dataset behind the chart failed. Fix: open the dataset and run it.
- Tiles overlap unexpectedly. Cause: tiles are free-form and can overlap. Fix: use the Tile controls (X, Y, width, height) or drag the tile.
- The Reset filters button is missing. Cause: it only appears when the Reset filters button setting is on and at least one filter differs from its default. Fix: turn the setting on in Customize.
- A published dashboard still shows old data in a workspace. Cause: the published copy is older than your Designer copy. Fix: choose Save dashboard, then Publish again.
- "Error occurred" when saving. Cause: the save failed. Fix: try again, and ask an administrator to check your Dashboard permissions if it repeats.
Related chapters#
- Chapters 1 and 2 for the content of tiles and filters.
- The Administration guide, chapter 4, for permissions, and chapter 10 for copying dashboards between sites.