
6. Data lineage
Lineage is the recorded journey of your data: which jobs and datasets write a table, and which jobs, datasets and dashboards read it. Two words you will see throughout:
- Upstream means before: the sources and jobs that feed a table.
- Downstream means after: everything that uses the table.
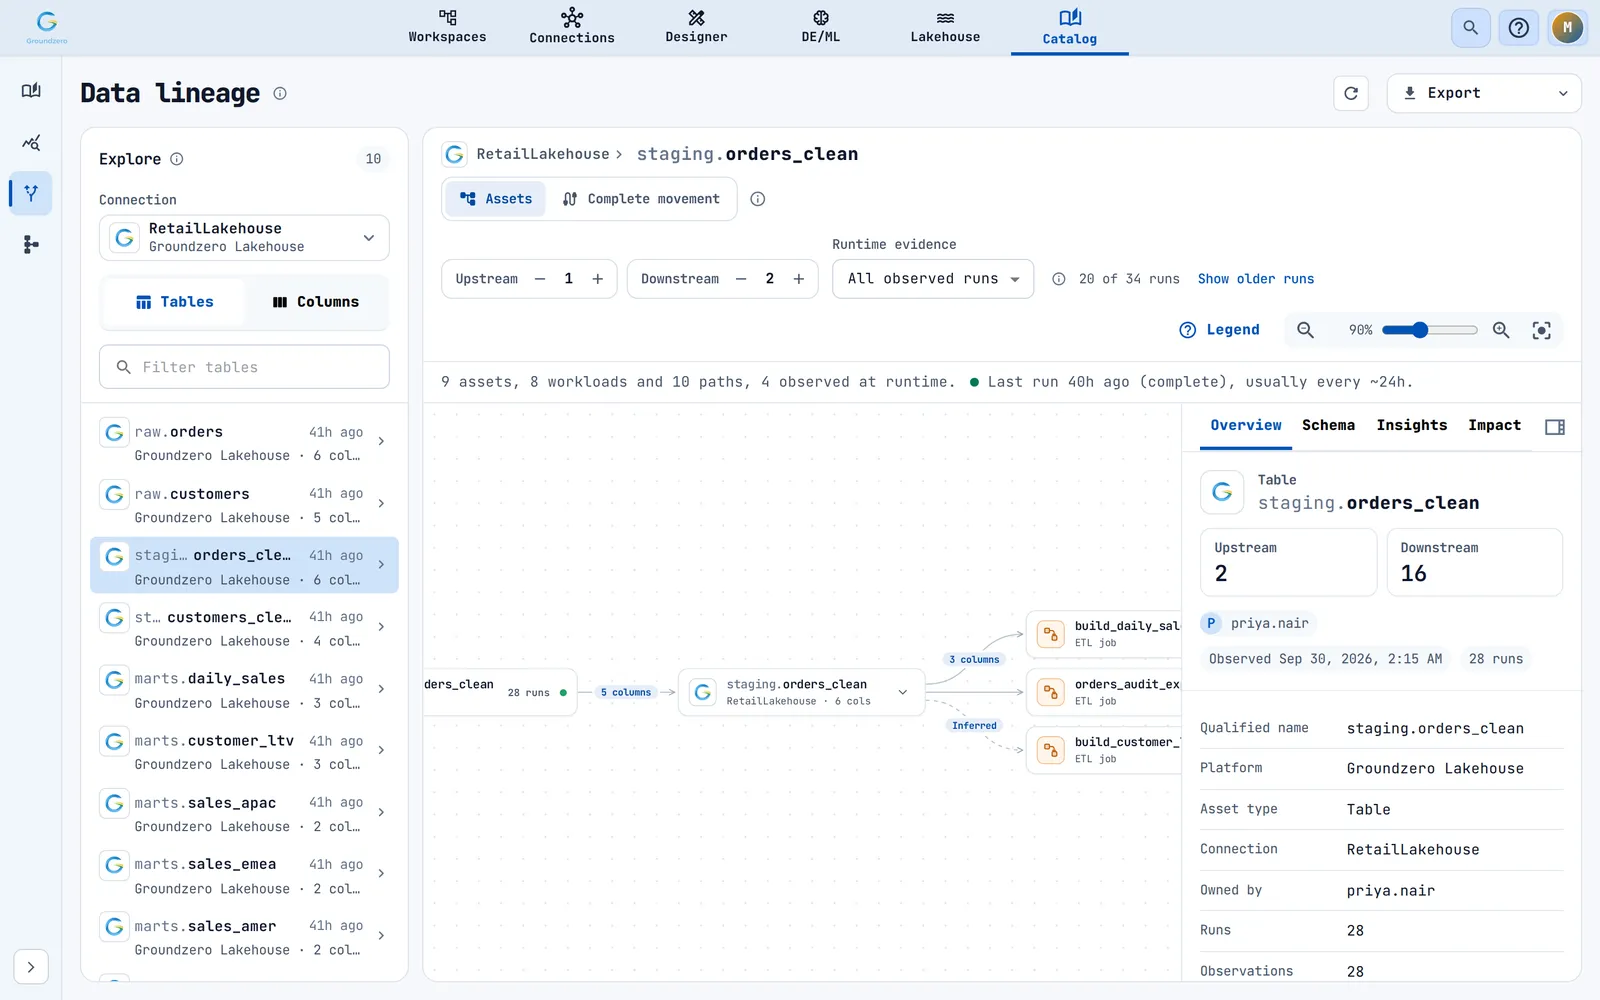
Pick a table and Groundzero draws a map of its upstream and downstream, down to individual columns.
Open Catalog in the top navigation bar, then Data Lineage in the module menu.
| I want to... | Go to |
|---|---|
| Find a table and open its map | "Open the map for a table" |
| See what breaks if I change or drop a table | "See what breaks if a table changes" |
| Find where a wrong number came from | "Trace a value back to its source" |
| See which source columns feed a column | "Follow a column" |
| Check if a path was really used | "How sure is a path" |
| Keep a record for a change ticket | "Export lineage" |
How lineage gets recorded#
You do not enter lineage by hand. It appears as your jobs and datasets run.
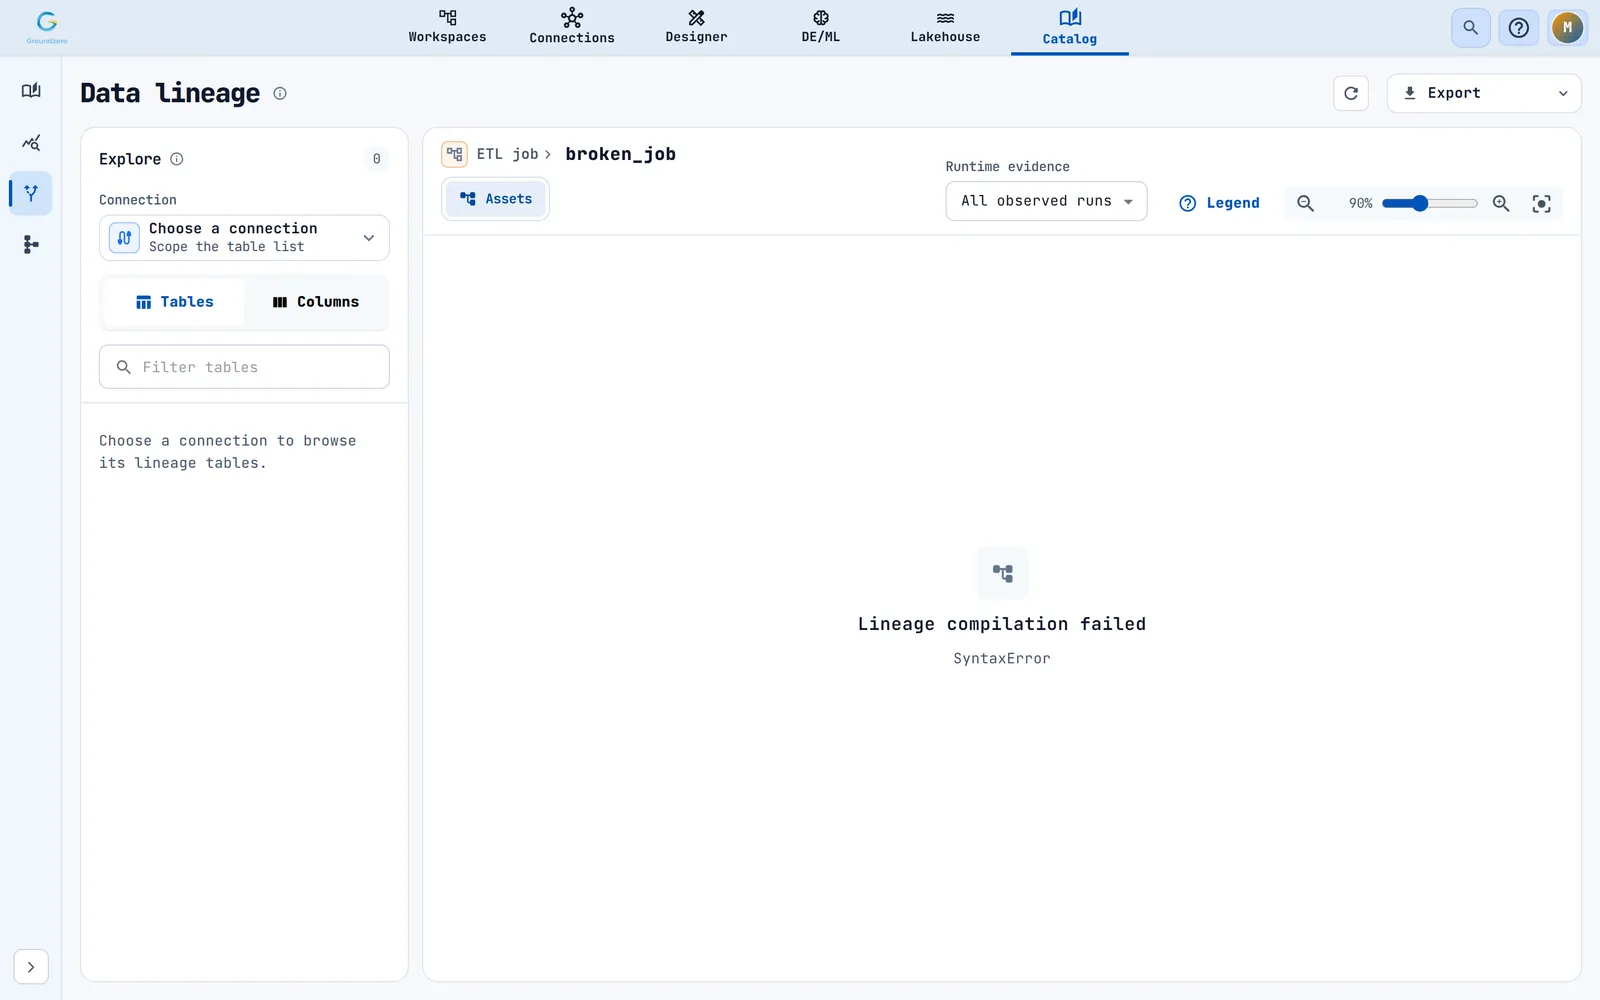
- From the code. When a job or dataset runs, Groundzero reads its code (Python and SQL) to learn which tables and columns it reads and writes. If this analysis fails, the run is not affected; the lineage page shows "Lineage compilation failed".
- From the runs. While a run executes, Groundzero notes the tables it actually reads and writes. A finished run can take a short while to show up.
- When you open the map. Dashboards, owners and impact are worked out at that moment from what has been recorded.
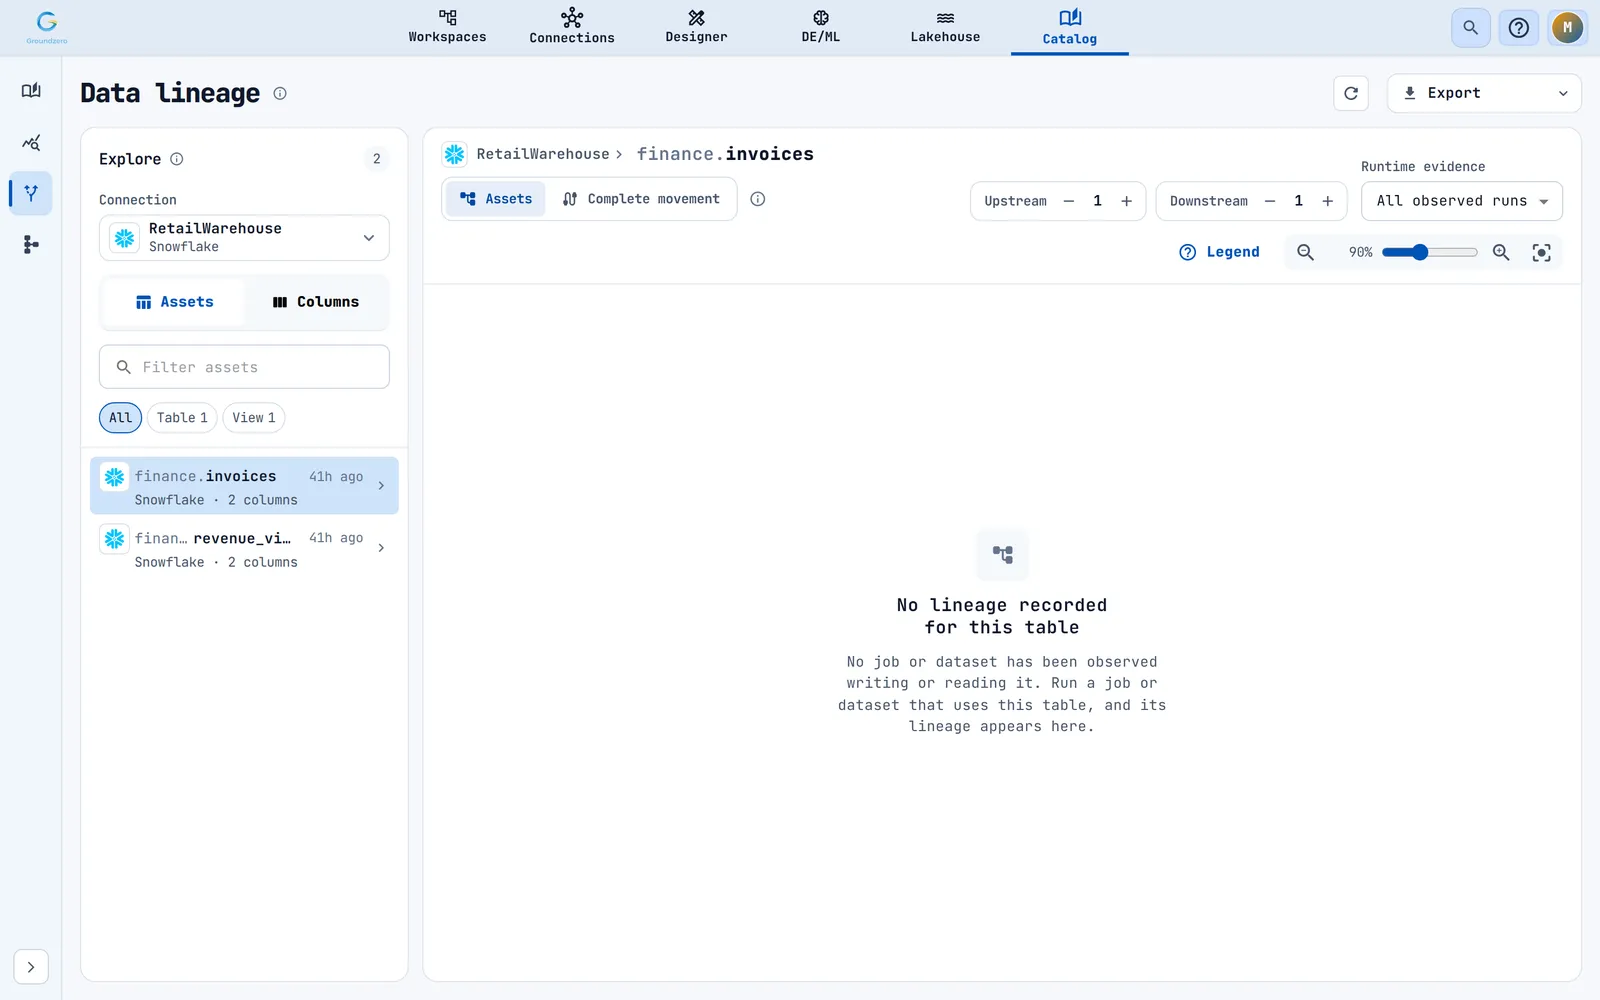
A job or dataset that has never run has no lineage. If a map is empty, run the job once.
How sure is a path#
Every line between two cards is labelled by its evidence:
- A solid line is Runtime observed: it happened in a real run.
- A dashed line is Derived from code: the code says it should happen, but no run has confirmed it yet.
Run the job to turn a dashed line solid.
Permissions#
| To do this | You need |
|---|---|
| Browse a connection's tables | Describe (or All) on the connection |
| See a table's map | Describe access to at least one of the table's connections. Anything else you may not describe appears as a grey placeholder. |
| See the lineage of a job or dataset | All or Describe on it |
| Use the Insights tab | Permission to use AI Chat |
| See the "catching up" banner | All on ETL jobs |
Open the map for a table#
Outcome: a map centred on the table you care about.
The left panel is titled Explore. A pill shows how many assets match.
-
Open the Connection picker ("Choose a connection") and choose the connection that holds your table. Type in Search connections to narrow the list. Clear connection removes the choice.

The connection picker lists connections that support lineage. Only connections that can have lineage are listed (databases, warehouses, streaming and the Groundzero Lakehouse). Others, such as AI providers and REST APIs, are hidden; the footer says how many.
-
Find the table. The Tables tab lists tables with the time each was last observed. Type in Filter tables to search by name. When the connection holds several kinds of object, Asset type chips (for example Table and View) filter them. Click Load more after 50 rows.

Choosing a connection lists its tables with the time each was last observed. 
Asset-type chips filter a connection that holds tables and views. -
To find a table by a column it contains, switch to the Columns tab and type the column name, for example
order_total. Matching tables are listed as "Matches ...".
Searching columns finds tables whose columns match, listed as "Matches ...". -
Click the table. Its map opens.


If a list stays empty you will see "Choose a connection to browse its lineage tables.", "Enter a column to find matching tables." or "No matching tables."
Read the map#
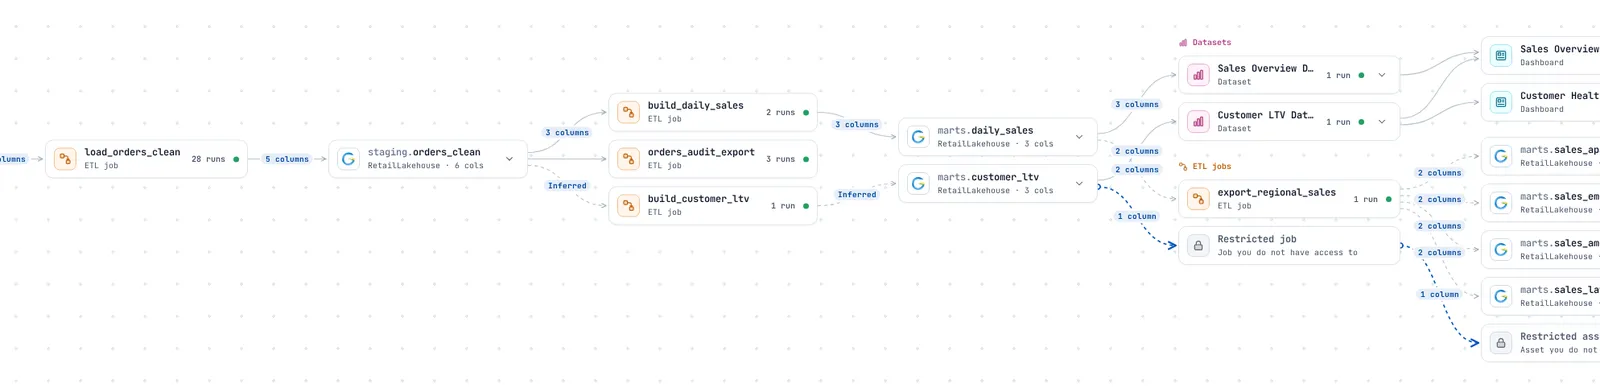
Cards run left to right from sources to consumers.

| Card | Shows |
|---|---|
| Table or asset | The connection logo, the name, the number of columns, and a Deleted badge if it was deleted at the source |
| ETL job or Dataset | Its name, how many times it ran (or Failed, Running, Queued, Compiling) and a status dot: green complete, red failed, amber running |
| Dashboard | Its name and number of widgets |
| Group | "N assets" or "N datasets" when more than three hang off one card; click to open it |
| Restricted | A placeholder for something you may not describe |
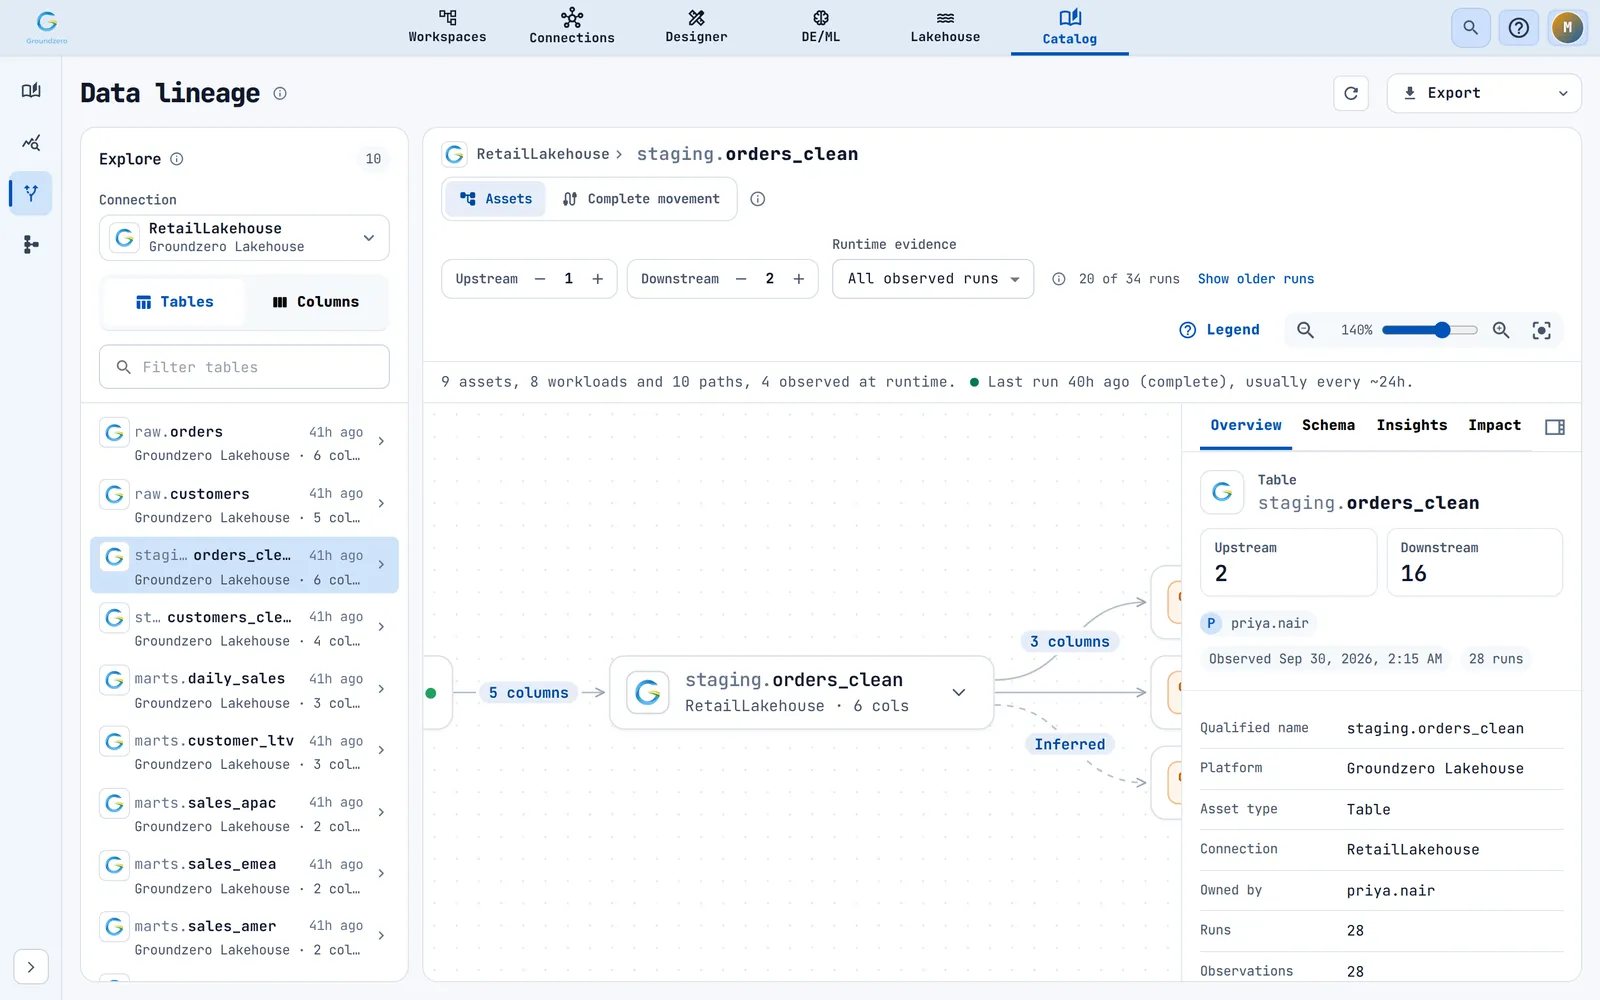
A pill on a line shows "N columns", or Inferred when only the table-level flow is known. Hover a card to light up its whole upstream and downstream path.
How to move around:
- Drag empty space to pan. Drag a card to move it (positions last for this browser session).
- Click a card to select it; click empty space or press Esc to clear.
- Use Zoom out, the slider, Zoom in and Fit lineage to zoom. If the map looks odd, press Fit lineage.
The summary line#
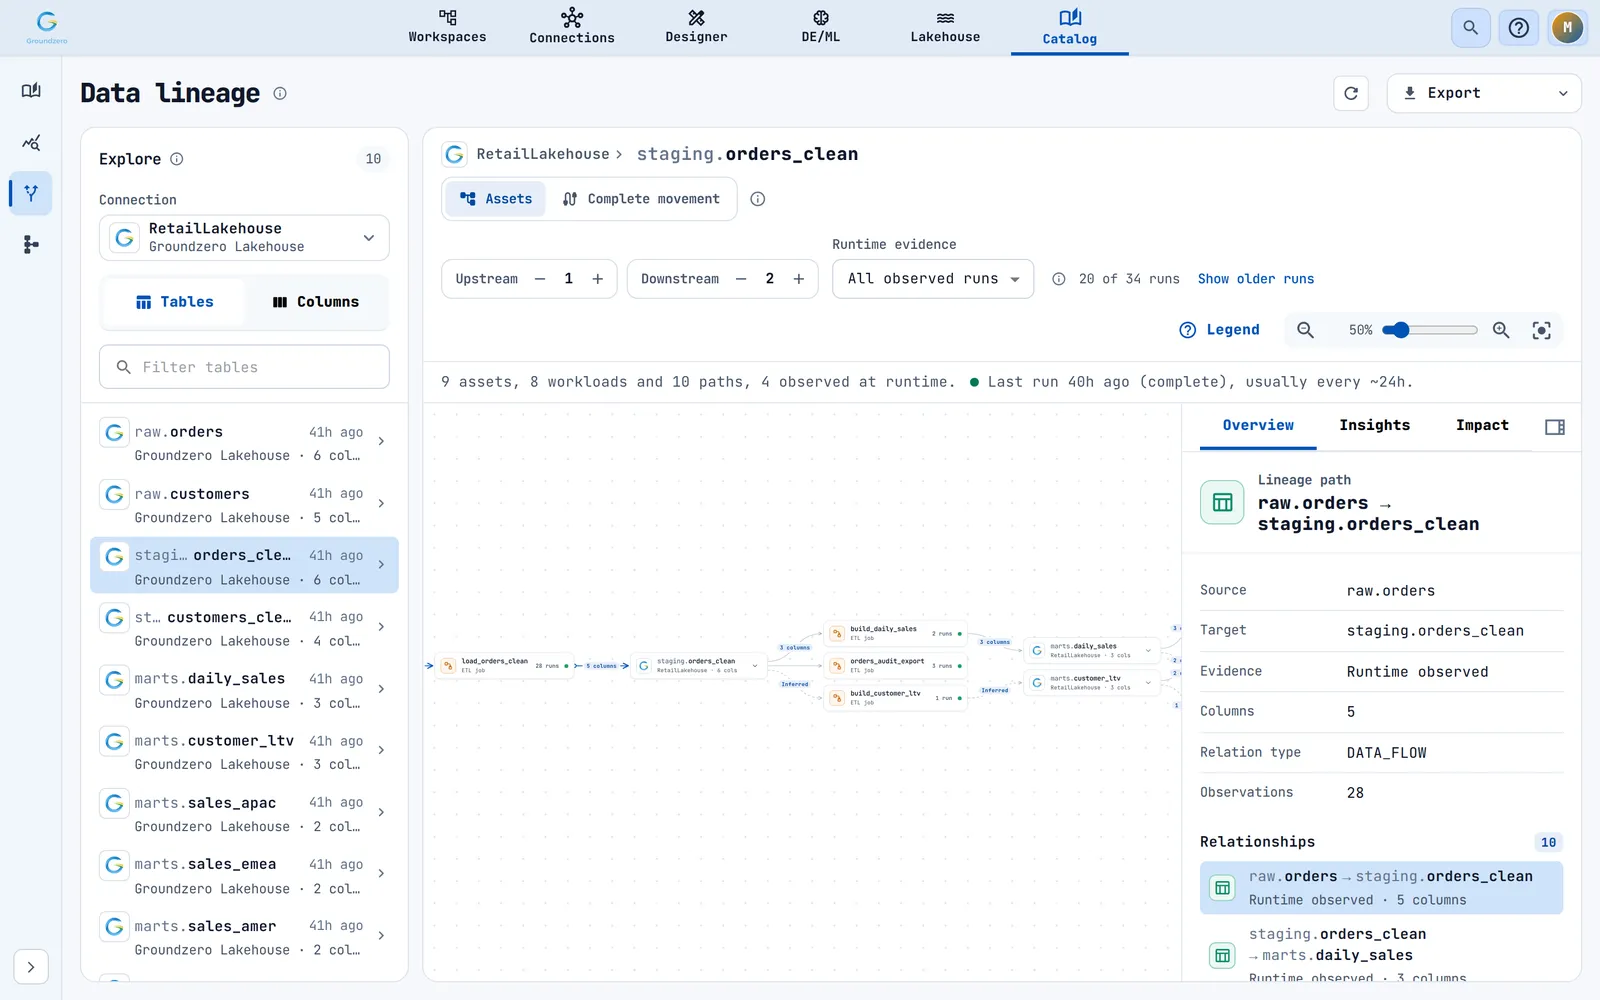
Under the toolbar, one line sums up the map, for example "9 assets, 8 workloads and 10 paths, 4 observed at runtime. Last run 39h ago (complete), usually every ~24h." It also tells you if the newest run is overdue, if no runs were observed, or if analysis failed (Compile failed).
Walk further upstream or downstream#
The Upstream and Downstream steppers set how many steps to follow each way, from 0 to 5. The default is 1 each. At least one side must be 1 or more. The map reloads when you change them.


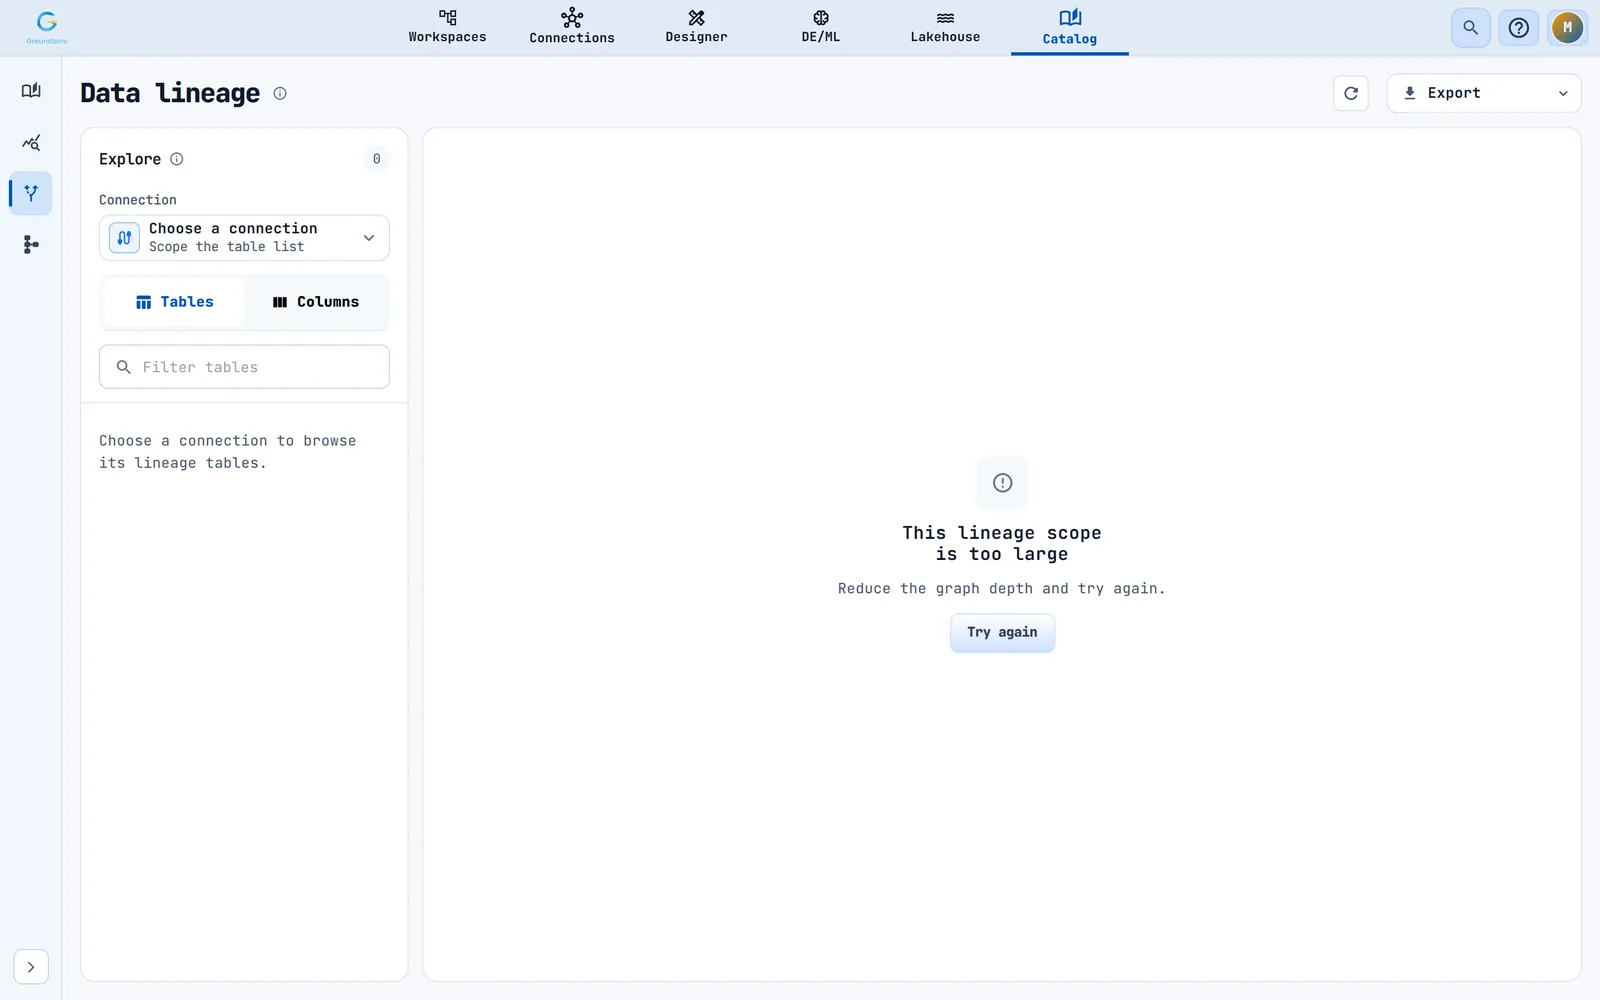
The map draws up to 250 cards. If there are more you see "Showing {visible} of {total} nodes for interactive performance. Select a narrower asset scope to see the omitted paths." If the graph is too big, you see "This lineage scope is too large. Reduce the graph depth and try again."
Tip
Start with 1 step each way and add steps only where you need them.
See what breaks if a table changes#
Outcome: a list of every job, dataset, dashboard and business definition that depends on the table.
- Open the table's map and click the table card.
- Open the Impact tab in the right panel.
-
Use Depth (1 to 5 levels, default 3) to choose how far to look.
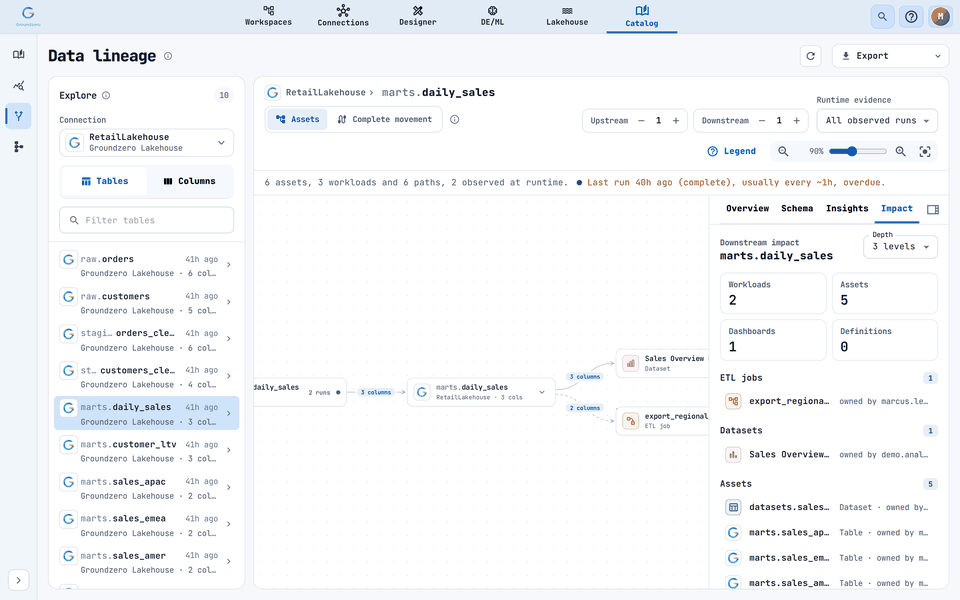
Impact: workloads, assets, dashboards and definitions that depend on the table. 
The depth select.
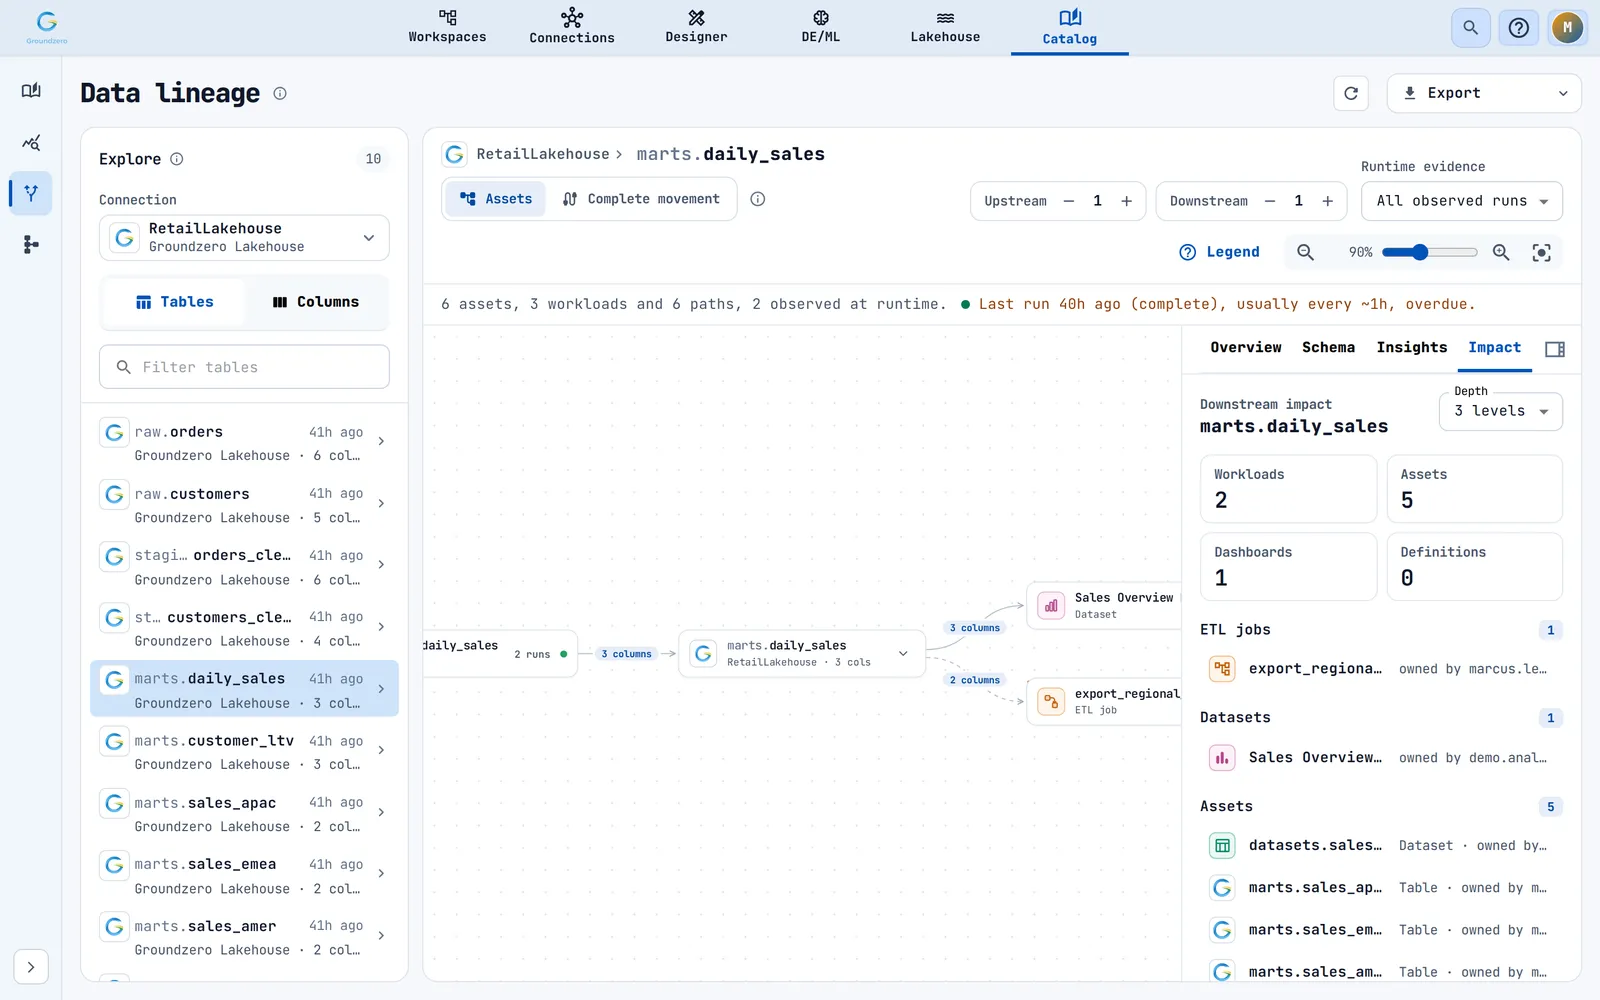
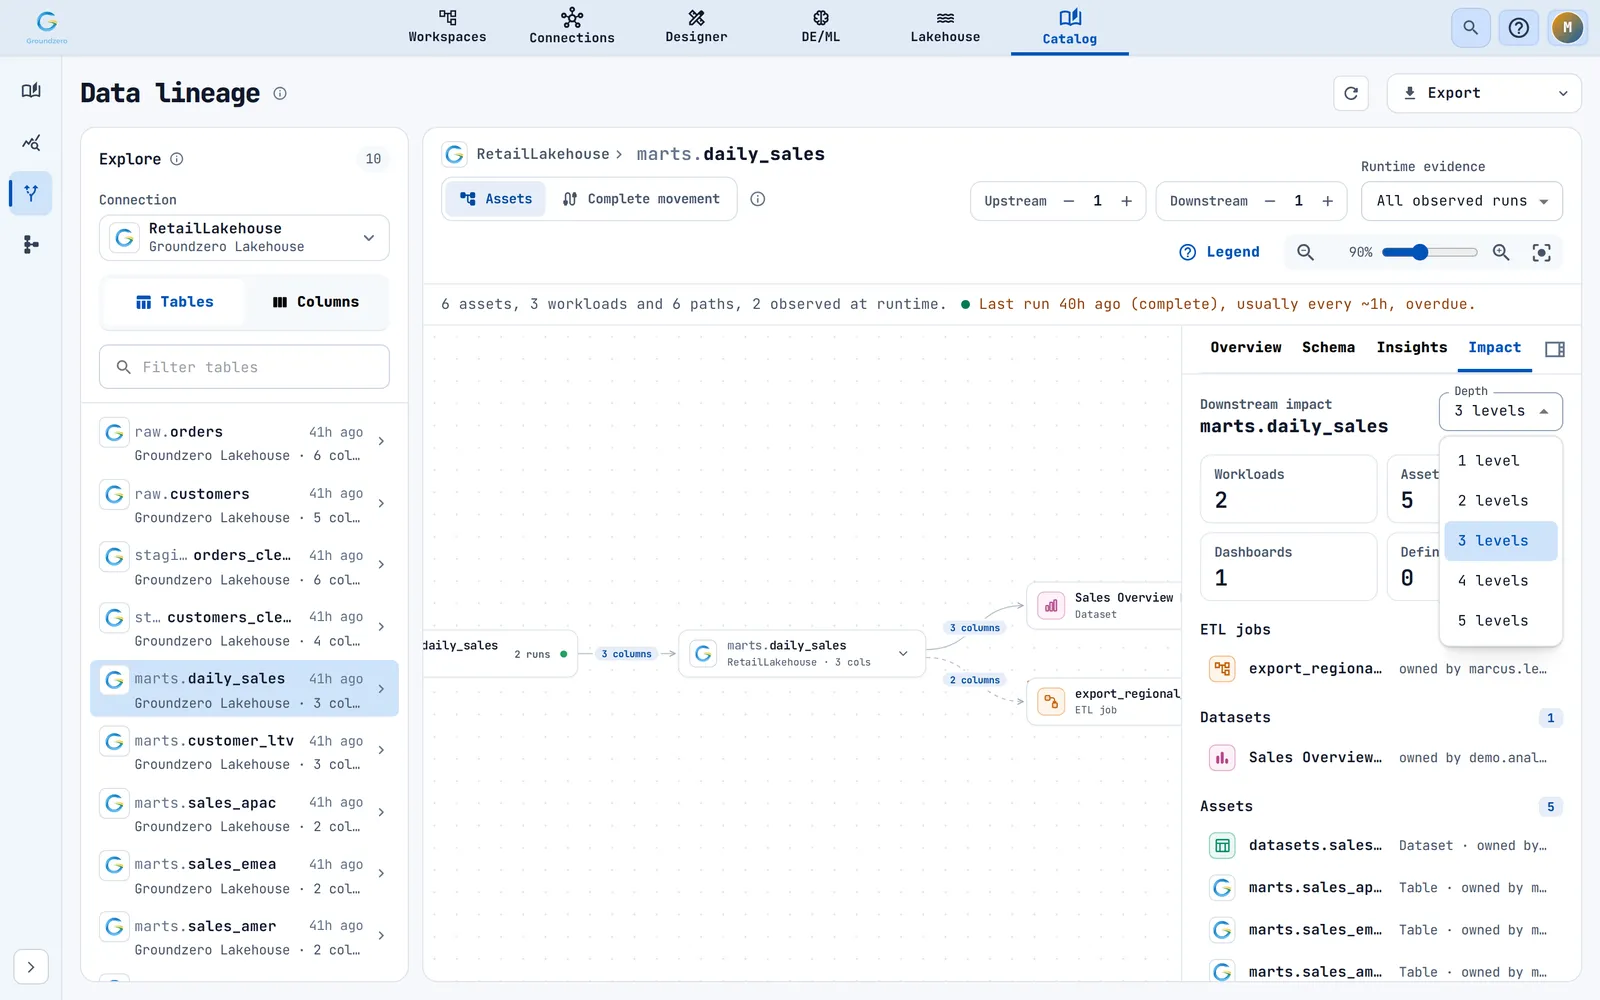
The tab shows counts for Workloads, Assets, Dashboards and Definitions, then lists them: ETL jobs, datasets, assets (with owner and last observed time), dashboards and business definitions. A business definition is a meaning recorded in Ontology Studio; you only see those you may read.
If nothing depends on the table you see "Nothing downstream reads from this asset in the recorded lineage. It is safe to change." Other notes: "Impact continues beyond the first {n} datasets shown." and "{n} restricted workload(s) not shown."
For a selected job the tab says "Impact flows from this job's outputs. Select an asset on the canvas to trace what it feeds."
Tip
Check Impact at depth 5 before dropping a table, and export the audit pack (see "Export lineage") for your change ticket. Lineage only knows about jobs and datasets that have run, so it can miss a user who queries the table by hand.
Trace a value back to its source#
Outcome: the job, and the source table, that produced a number.
- Open the map of the table that shows the wrong value.
- Raise Upstream until you reach the source (try 3).
-
Click the job card feeding the table. The Overview tab shows its owner, when it last ran and its status. Open job or Open dataset goes to it.
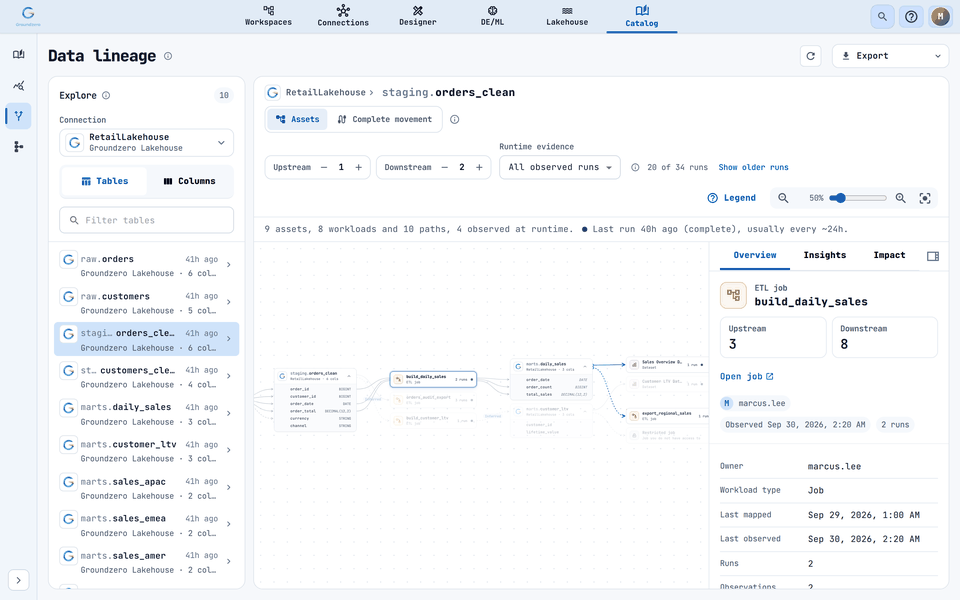
A job card: owner, workload type, last mapped and observed times. -
Click a line to see how the two ends connect and whether it was observed in a run.
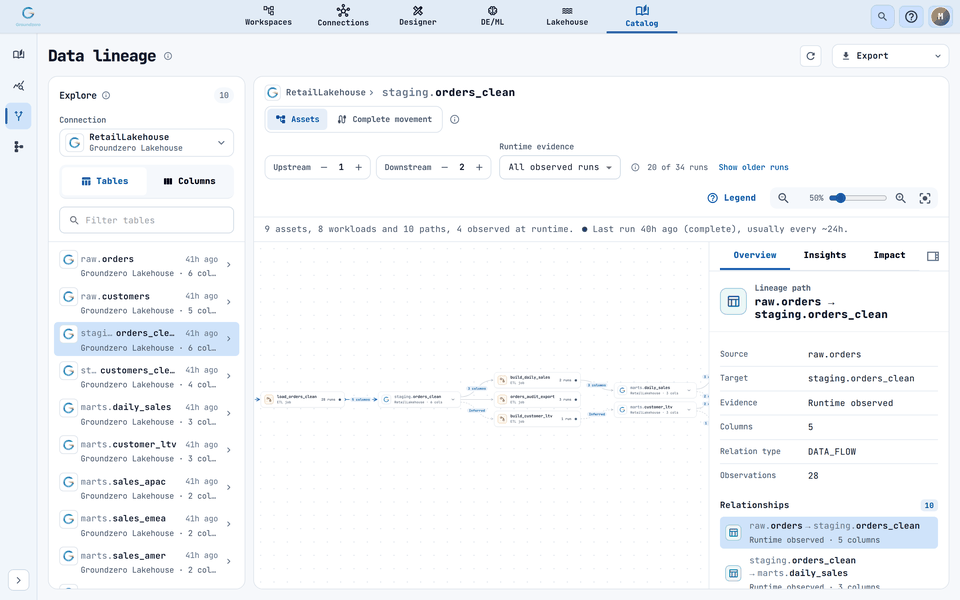
Clicking an edge shows the flow's evidence and relationships. -
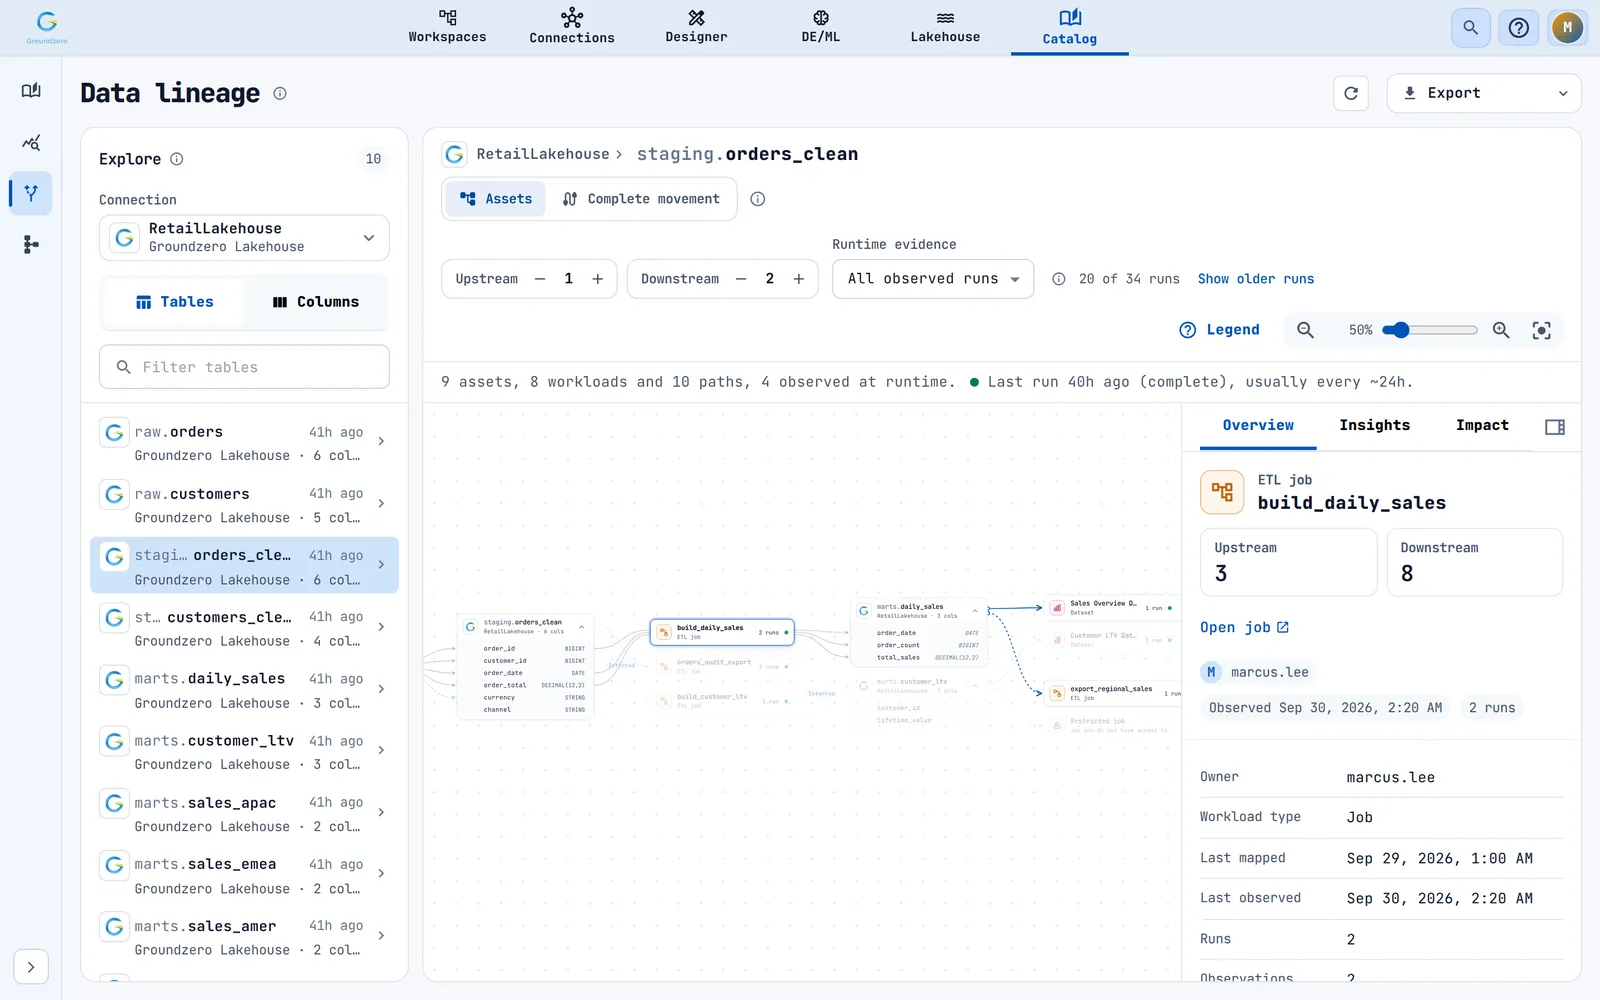
To see only what one run touched, choose it in Runtime evidence (see "Check one run").
Follow a column#
Outcome: which source columns feed a column, and whether it was renamed or changed on the way.
- Click the arrow on a table card (Show columns for <name>). Neighbouring tables open too. Up to 15 mapped columns are shown, then "+N more columns".
-
When two tables are open, curves join each source column to its target column through the job card. Click a column or a curve to focus on it. Click again, click empty space or press Esc to release.

Columns expanded: curves connect mapped columns across the job.

Curve labels tell you what happened: Direct mapping, Renamed, Transformed, Renamed + transformed, Transformation unknown or Renamed · transformation unknown.
Inferred flows
When Groundzero cannot work out the columns (for example when the code uses SELECT *), the flow has no curves and shows Inferred ("Inferred, columns unknown"). The table-level flow is still correct.

Groups#
When more than three cards hang off one card, they collapse into one group card. Click it to open the group for the rest of your visit.

Check one run#
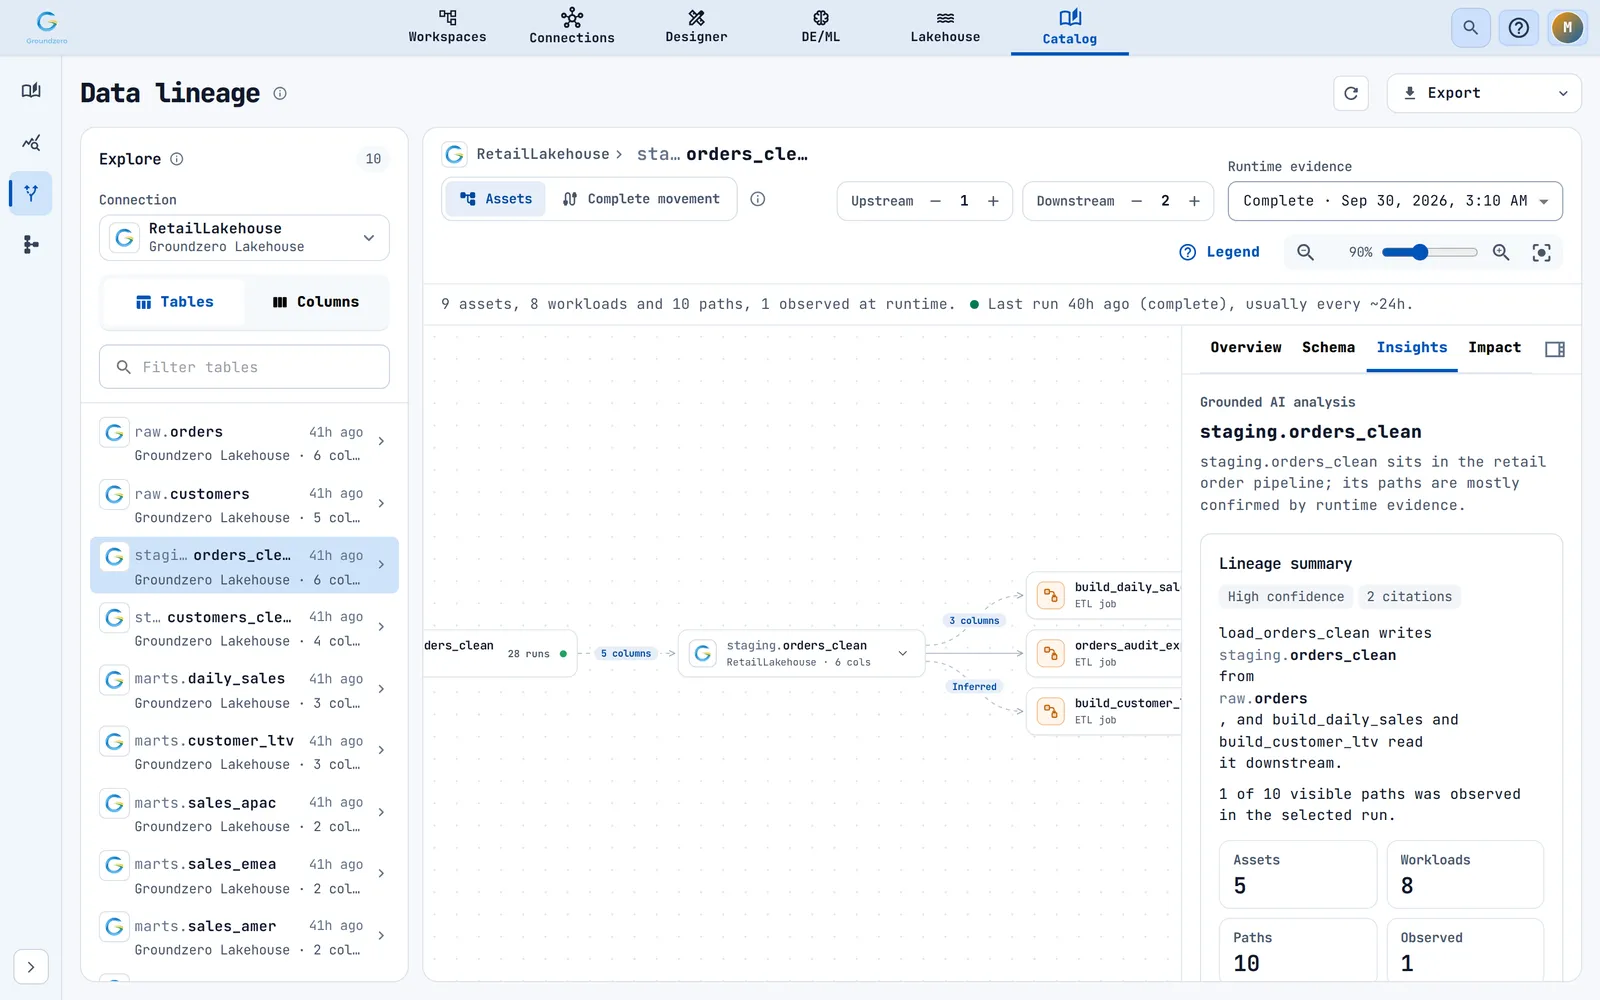
The Runtime evidence list shows "All observed runs" or one run, for example "Complete · Sep 30, 2026, 3:10 AM". Choose a run to see only what that run observed. The legend wording changes to "selected run" and the details panel gets a Selected run section (Run ID, Started, Stopped, Duration).
The map loads the 20 most recent runs. The toolbar says, for example, "20 of 34 runs". Click Show older runs to load more (up to 100). The shape of the map is always complete; only the run history is limited. If it fails you see "Older runs could not be loaded." A map with a running or queued run refreshes itself every 10 seconds.
Use the details panel#
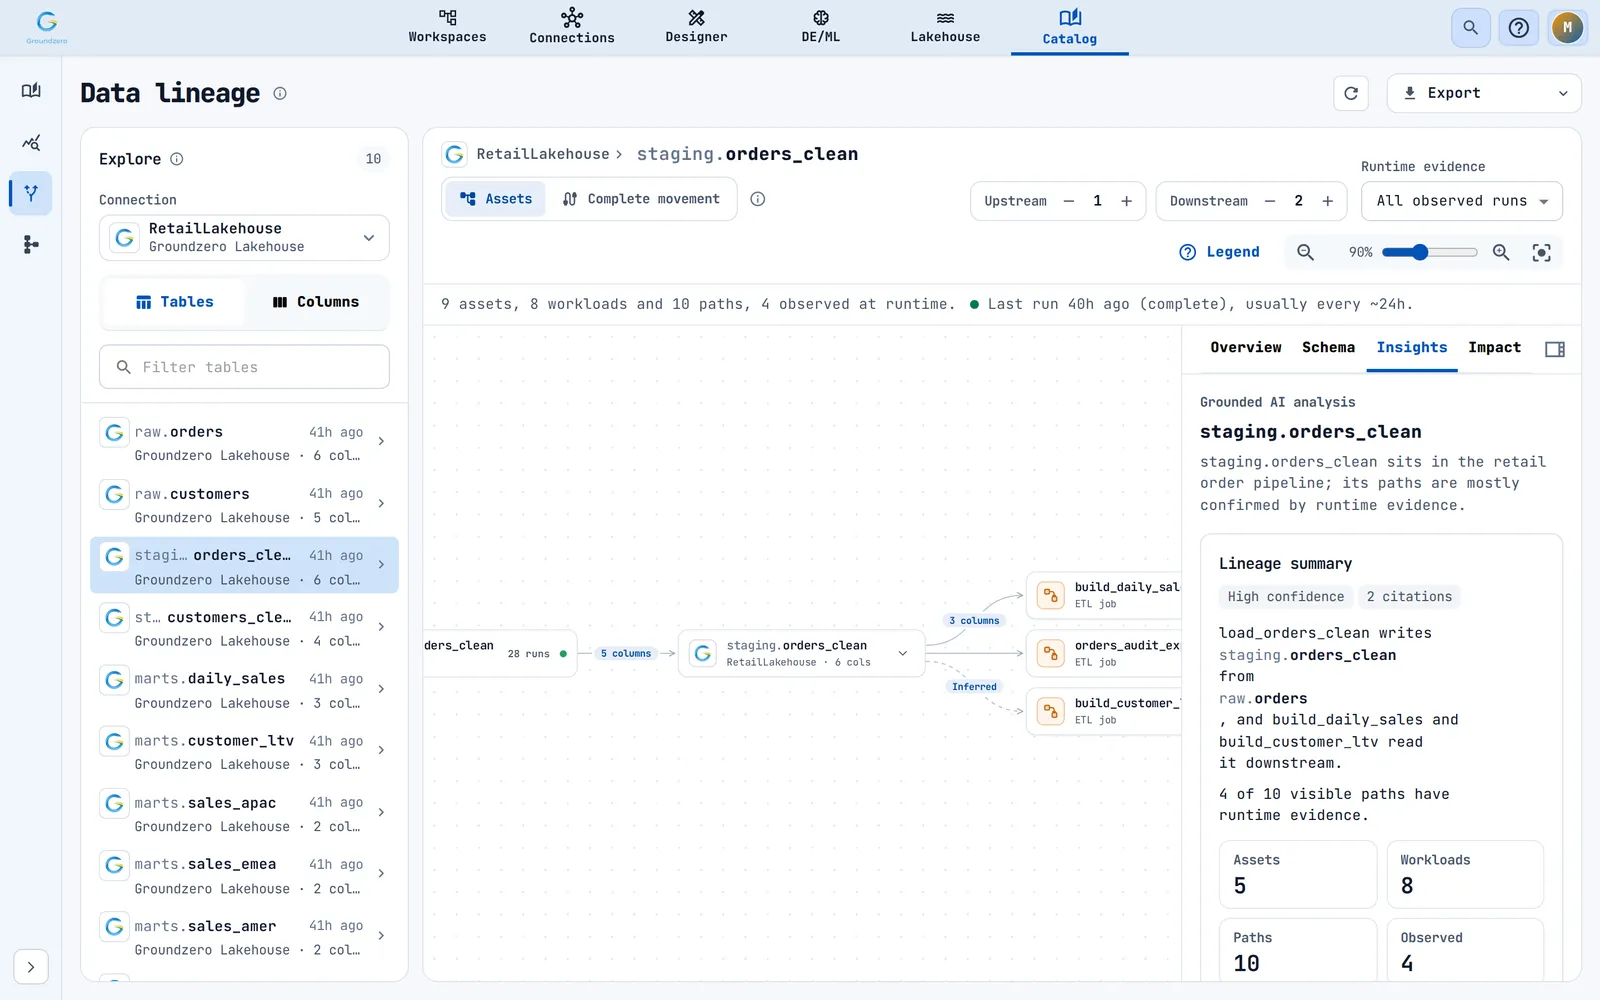
The right panel has the tabs Overview, Schema (for tables), Insights and Impact. The toggle Hide lineage details collapses it to a thin strip so the map gets the full width.

Overview#
The header shows what you selected (Table, Dataset, ETL job or "Lineage path"), its name, the Upstream and Downstream counts and a row of trust signals: the owner (or "Unowned"), when it was last observed ("Not observed" if never) and how many runs.
- For a table: its qualified name, platform, connection, owner, runs, columns, schema version, last observed time, and the jobs that write it (Written by) and read it (Read by). From code marks a job that has never run.
- For a job or dataset: owner, type, last mapped and last observed times, run count and a Diagnostics section with its analysis status and warnings. A dataset also lists the Dashboards built on it.
- For a line: source, target, its evidence (Runtime observed or Derived from code), the columns, how often it was observed, and Relationships to jump between lines.
Owners#
Groundzero works out owners for you. A job's owner is the person who owns or created it. A table's owner is whoever owns the latest job that wrote it; if none, the dataset's or connection's creator. When none can be found the panel reads Unowned.

Schema#
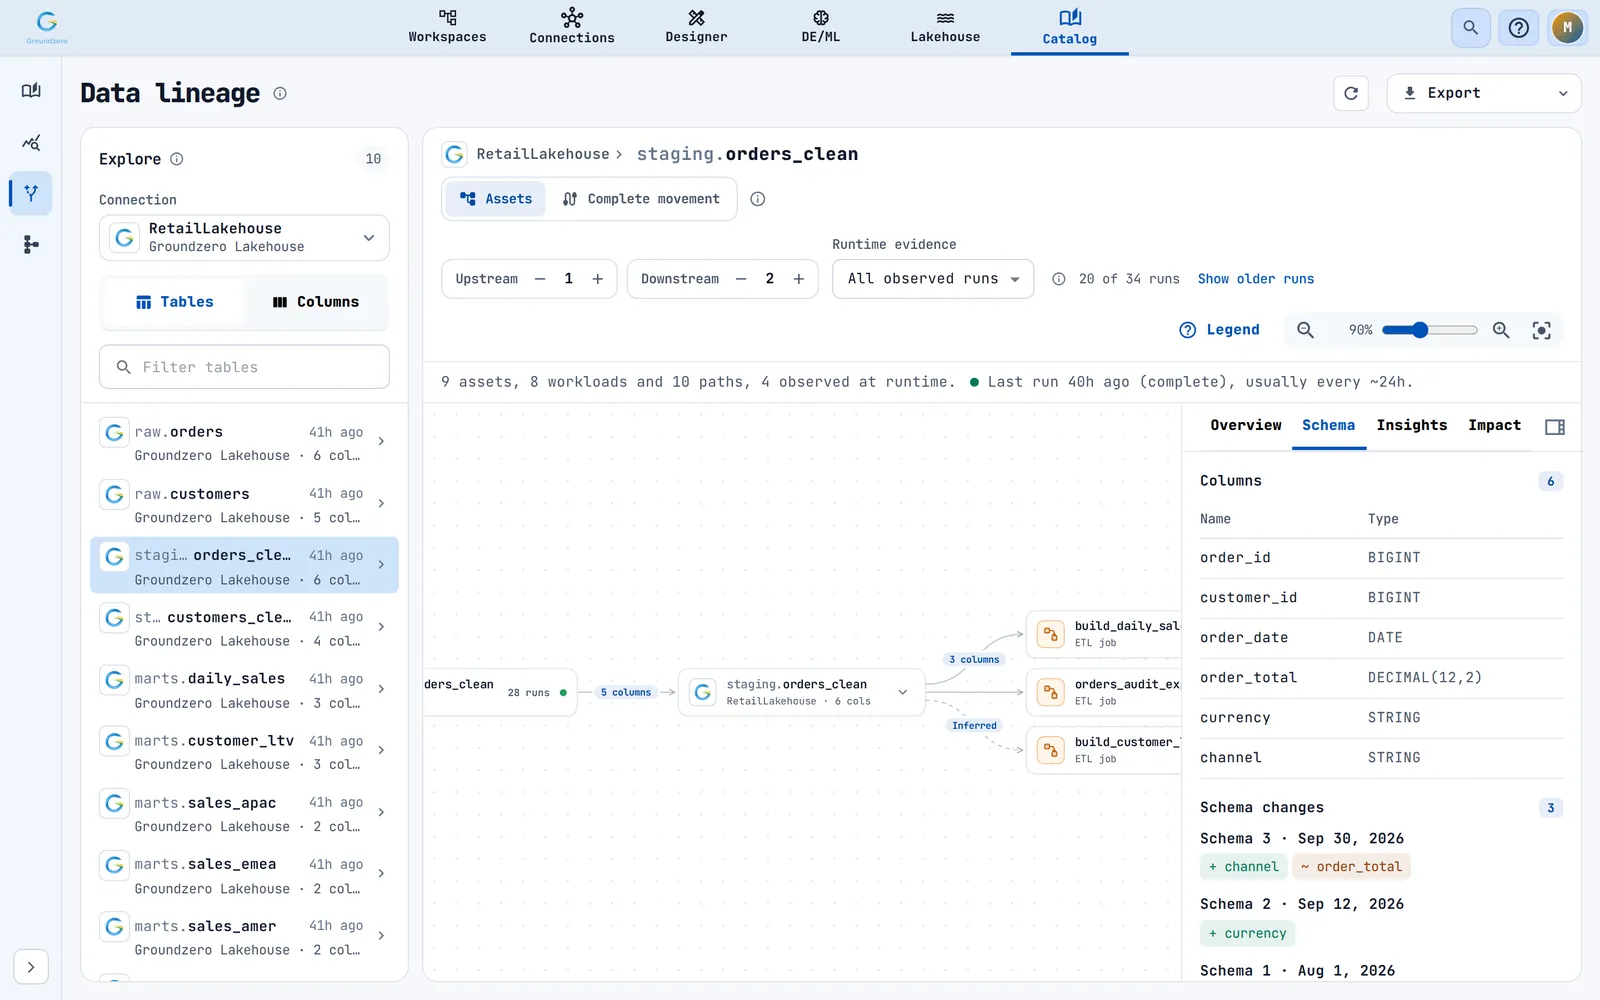
The Schema tab lists the table's Columns with their types, then Schema changes: the five most recent versions with chips for columns added, removed or changed. If you see "Schema not observed. Run a job or dataset that reads this table to record its columns.", run one.
Insights#
The Insights tab gives a plain-language reading of the map in four cards: Lineage summary, Breaking-change impact, Column transformations and Schema drift and evidence gaps. It starts with Evidence analysis, then changes to Grounded AI analysis when the AI answer arrives. AI cards show a confidence level and the number of sources they cite; Show more expands long text.
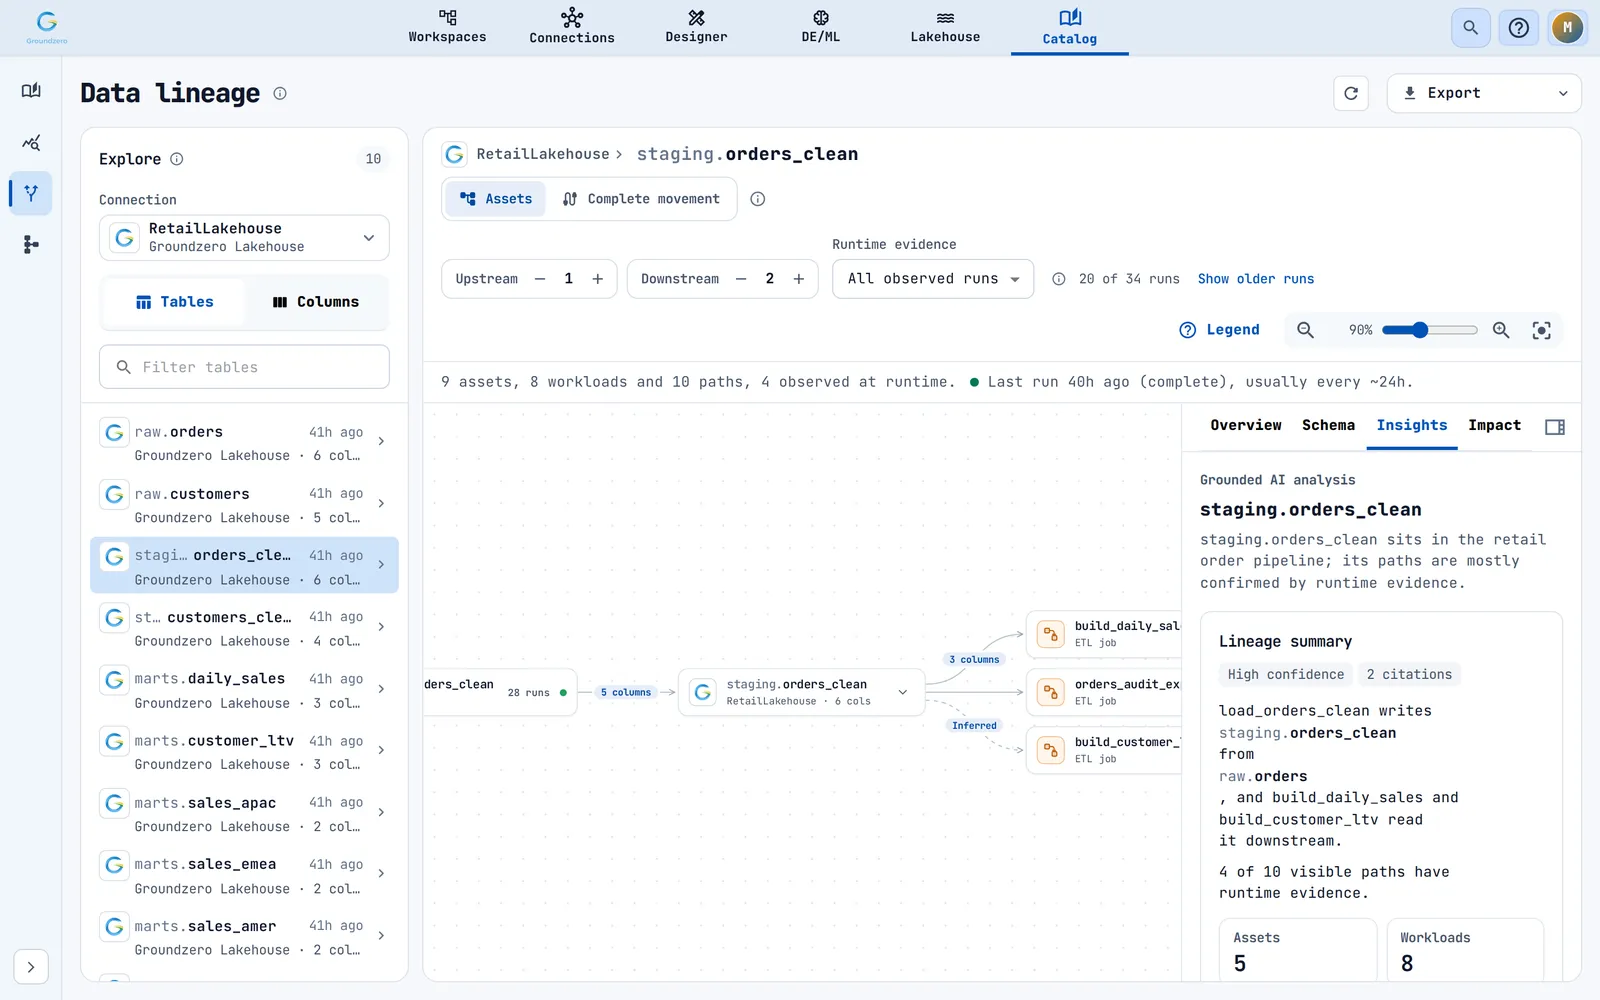
If AI is not available you see "AI analysis is unavailable. Verified graph evidence is shown instead." The cards built from recorded evidence still appear.
Dashboards#
Dashboards are drawn in the rightmost lane, after the datasets they are built on. Raise Downstream to bring them in. Select a dataset to see its Dashboards list in Overview.


Restricted items#
Anything you may not describe shows only as a placeholder, and the rest of the map still works.

The panel says "You don't have access to this asset. Ask its owner for describe access to see its name, schema and evidence." If the table you started from is restricted, you see Lineage access is restricted.

See every hop: complete movement#
Use the switch at the top of the map to change from Assets to Complete movement. This view adds every recorded hop and the saved datasets, visualizations and dashboards built on the table.
A bar lets you filter by kind (Table, ETL job, Dataset, Visualization, Dashboard) and by line style (Runtime observed, Derived from code, Saved reference), search with Find a node, and shows a count such as "23 nodes · 25 links".

Click a card for details: what it Reads from, what it Feeds and what is On its path. Close details closes them.

The view is limited to a set number of items; the footer says how many fall outside it. "No connected data movement is available for this mapped source." means nothing is recorded yet.
Start from a job or dataset#
You can also centre the map on one job or dataset instead of a table; the breadcrumb then reads "ETL job > name" or "Dataset > name". The usual way is to follow Open job or the lineage link from a job or dataset.


Export lineage#
Outcome: a file with the lineage you are looking at, or every connection for audit.
Open the Export menu.

| Group | Item | What you get |
|---|---|---|
| This view | Audit pack (JSON) | The full picture of the current map: counts, evidence, assets, relations, job versions and runs |
| This view | Spreadsheet (CSV) | One row per line: source, target, columns, job, owner and run |
| All edges on a connection | Table edges and Column edges (CSV or JSON) | Every link on the connection, up to 10,000 rows |
The first two are on once a map has loaded. A status line reports "Exporting lineage…" then "Exported {n} edge(s)." with notes such as "{n} edge(s) hidden by access rules." or "Only the first 10,000 were included." You only get rows for tables and jobs you may see.

Legend, refresh and the "catching up" banner#
Legend explains the cards (Asset, ETL job, Dataset, Group), direction, status, paths (Runtime observed, Derived from code) and columns (Mapped columns, Unknown mapping).
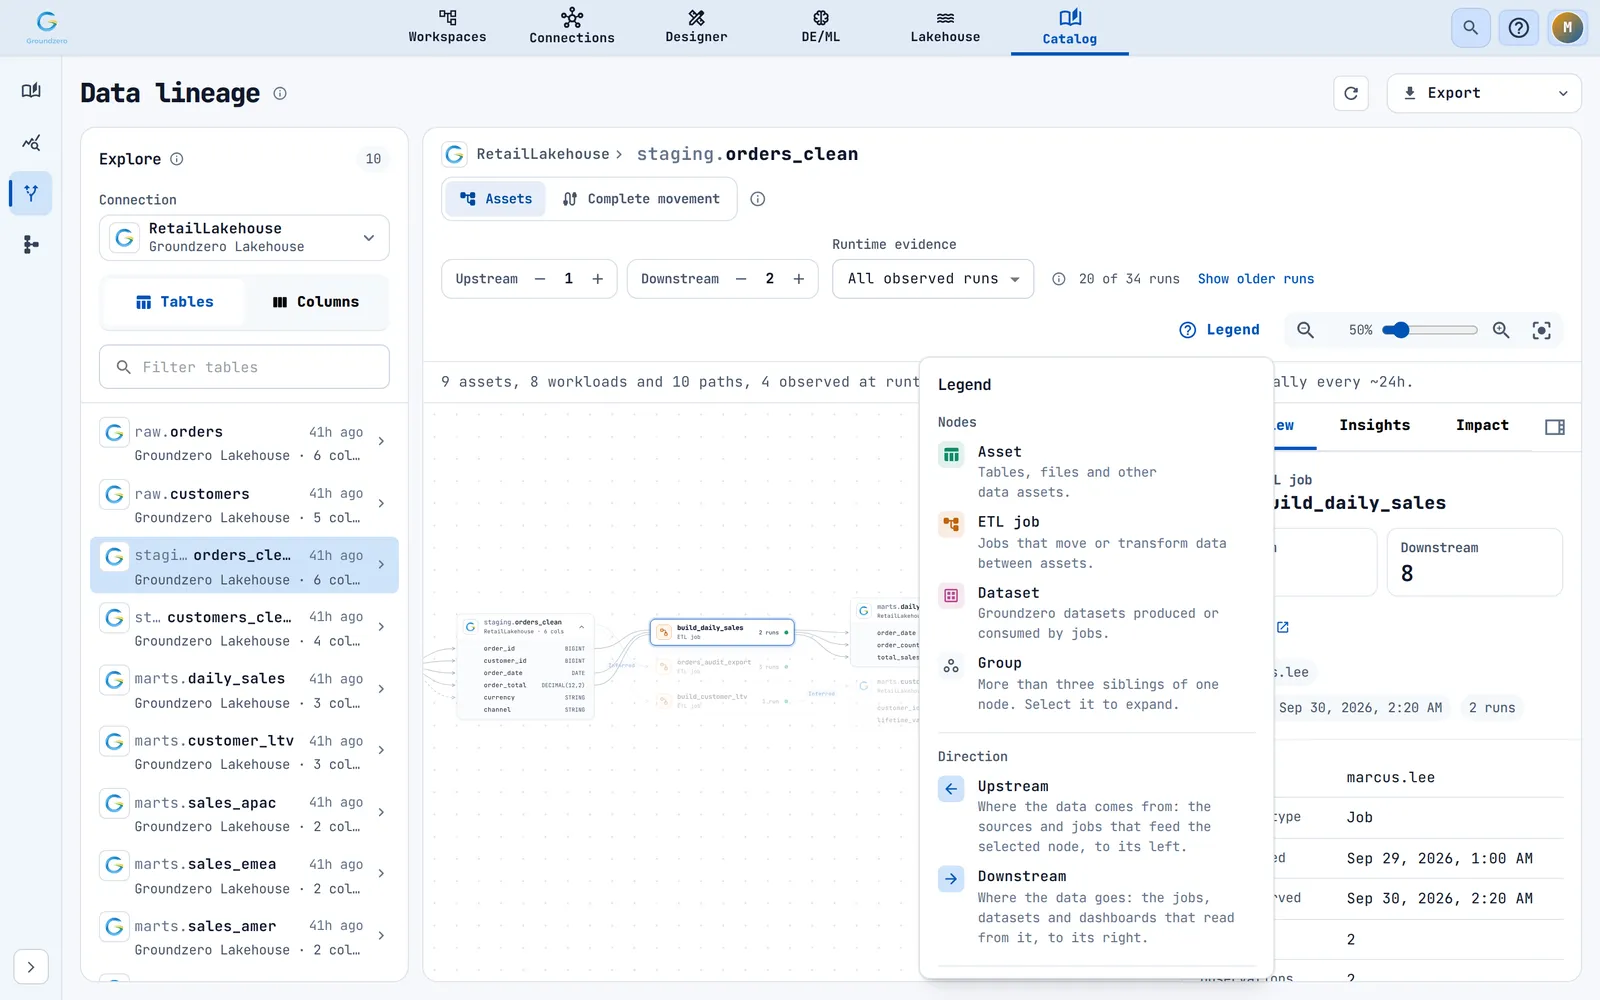
Refresh lineage (the circular arrow) reloads the connections, the table list and the current map.
If recent runs are still being processed, a banner appears:

"Lineage is catching up — some recent runs may be missing from this view." Wait a little, then press Refresh lineage.
When the page shows a message#
| You see | What it means and what to do |
|---|---|
| "Choose a table to trace" | Nothing is selected. Pick a connection and a table. |
| "No lineage recorded for this table" | No job or dataset has been seen writing or reading it. Run one that uses it. |
| "No lineage compiled yet" | Run this job or dataset after connecting its source and target. |
| "Lineage compilation failed" | The code could not be analysed. Review the code and run it again. |
| "Lineage access is restricted" | Ask the owner for Describe access. |
| "This lineage scope is too large" | Lower the Upstream and Downstream steps, then Try again. |
| "Lineage is not available" | The item no longer exists. |
| "Lineage could not be loaded" | Press Try again. |
Troubleshooting#
| Symptom | Cause | Fix |
|---|---|---|
| The explorer is empty | No connection chosen, or its type has no lineage | Pick a supported connection; run a job once |
| Lines are only dashed | Only the code was analysed | Run the job so a run confirms it |
| Inferred pills | Columns could not be worked out (for example SELECT *) |
List the columns in the code |
| Grey placeholders everywhere | You lack Describe access | Ask the owner of the connection, job or dataset |
| "This lineage scope is too large" | Too many steps | Lower the Upstream and Downstream steps |
| An AI warning in Insights | AI is unavailable or you lack permission | The evidence cards still work |
| Recent runs are missing | Only 20 are loaded | Use Show older runs |
Limits#
| Item | Limit |
|---|---|
| Steps each way | 0 to 5 (default 1); impact depth 1 to 5 (default 3) |
| Cards drawn | 250; groups form when more than 3 hang off one card |
| Runs loaded | 20 by default, up to 100 |
| Columns shown per table | 15 |
| Tables listed per page | 50 |
| Export | 10,000 rows |
Related#
- Data catalog: browse the same tables with descriptions and tags.
- Ontology Studio: business definitions that appear in the Impact tab.
- Lakehouse: the warehouses and tables lineage tracks.
- Designer and DE/ML (Build documentation): the datasets and jobs that produce lineage when they run.